Portfolio Analytics
Project Swimlanes
This article explains how to use the Analysis>Swimlanes page.
Overview
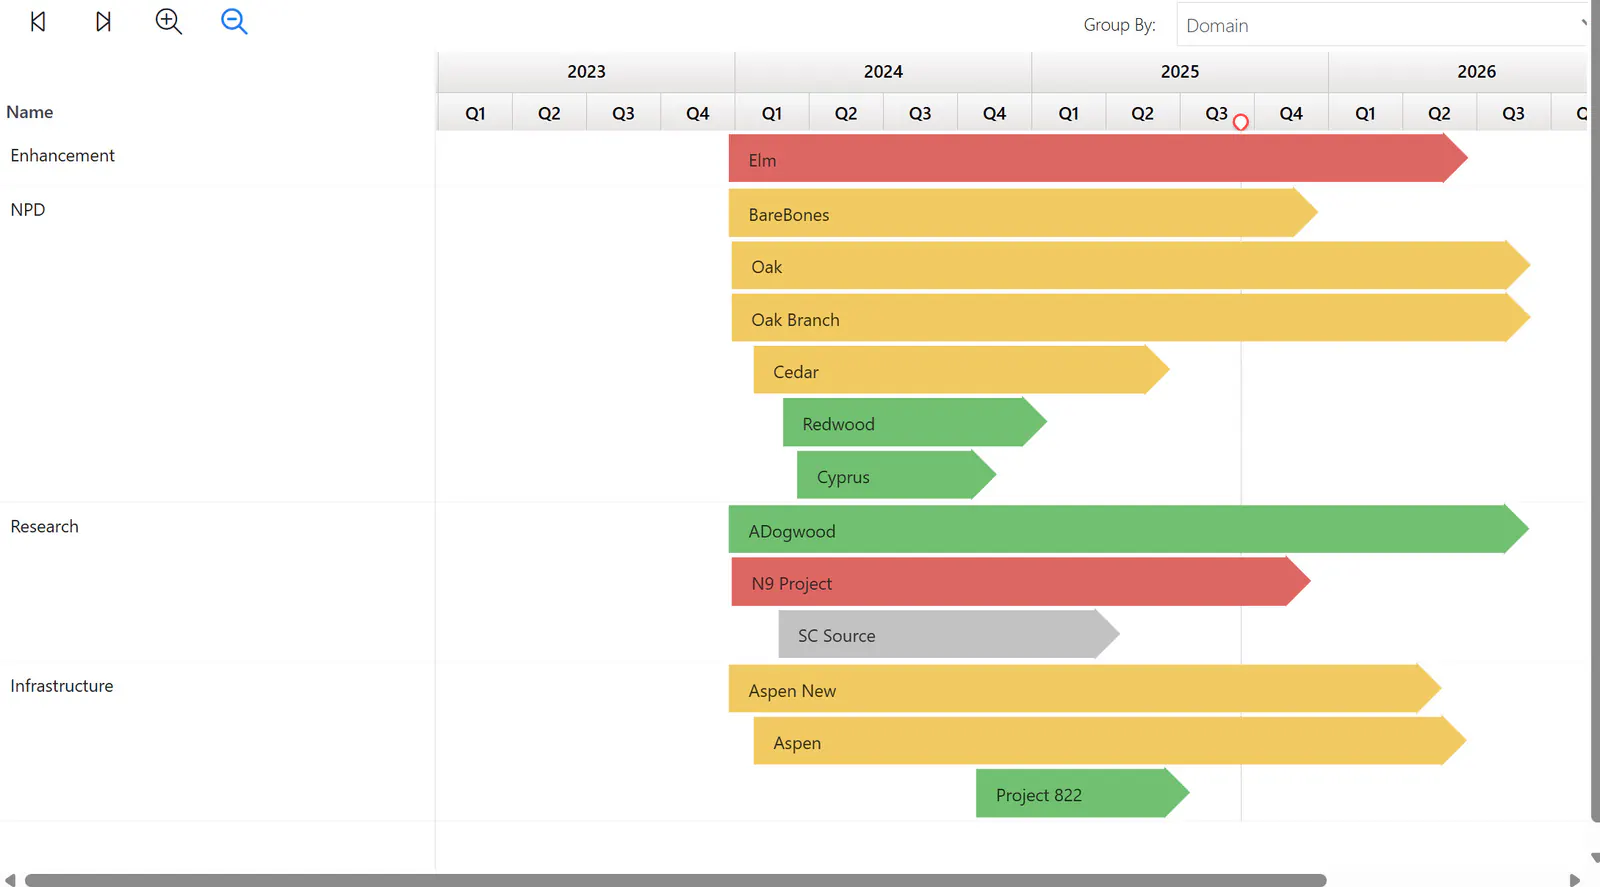
Project Swimlanes page displays a Gantt-type solid bar on a period date grid for all projects that have a start and finish date. The color of the bar matches the Green-Yellow-Red color of the overall Status field for each project.
You can move the timeframe forward and back, expand and shrink the timescale, and group the projects by any field on the Project Data page.
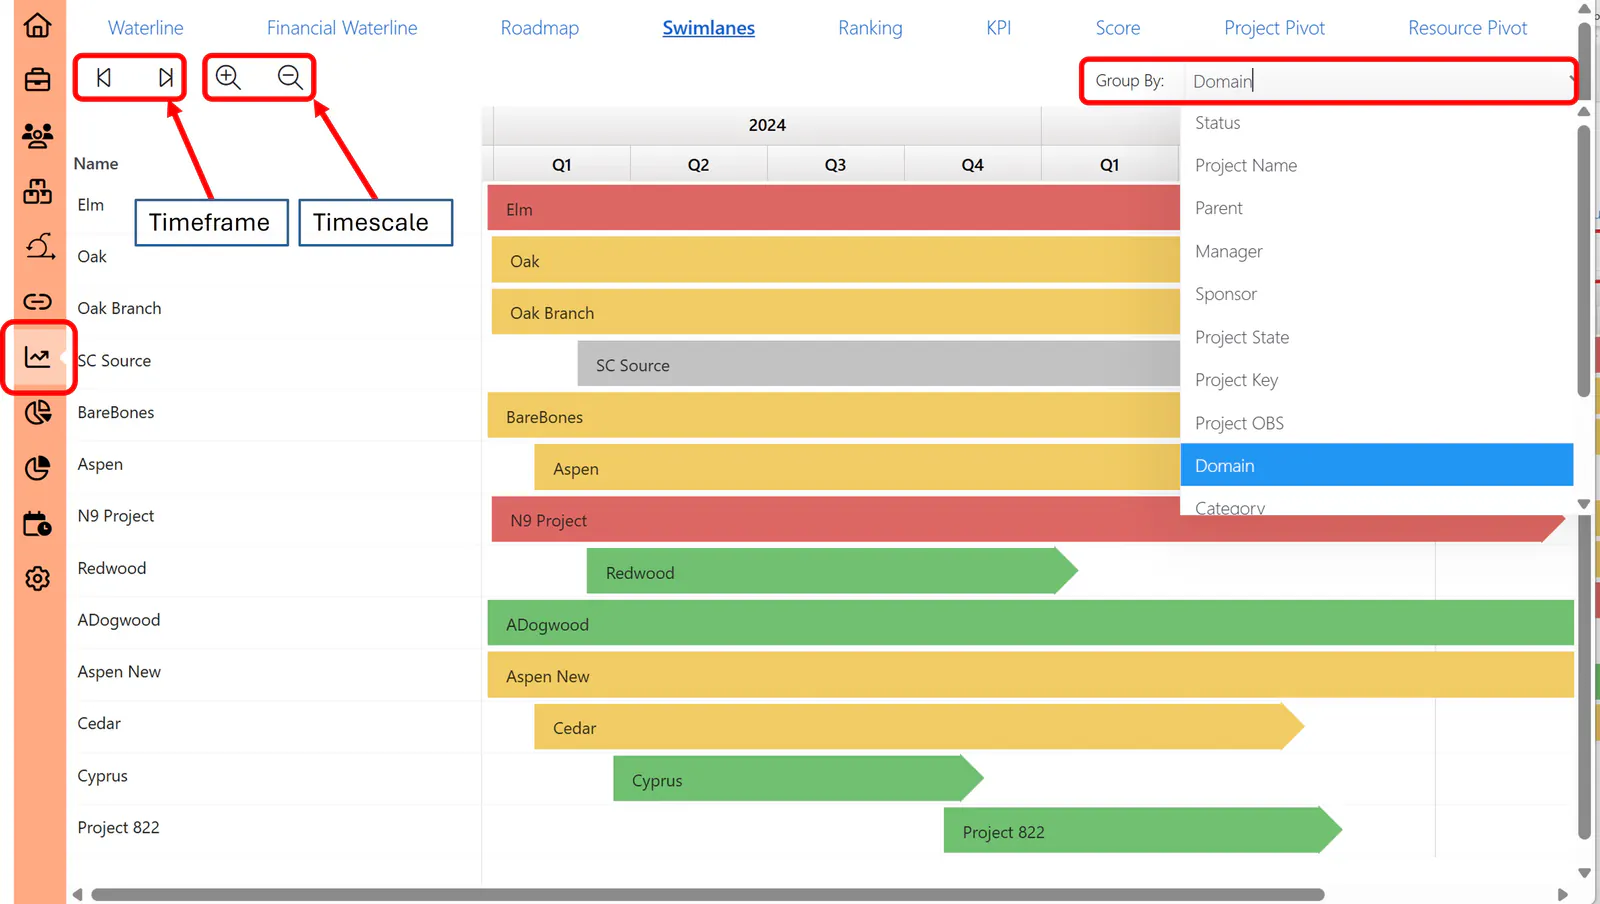
Timescale and timeframe adjusted and grouped by Domain.