Project Demand
This article explores the features of the Project Demand page in the Projects area.
Overview
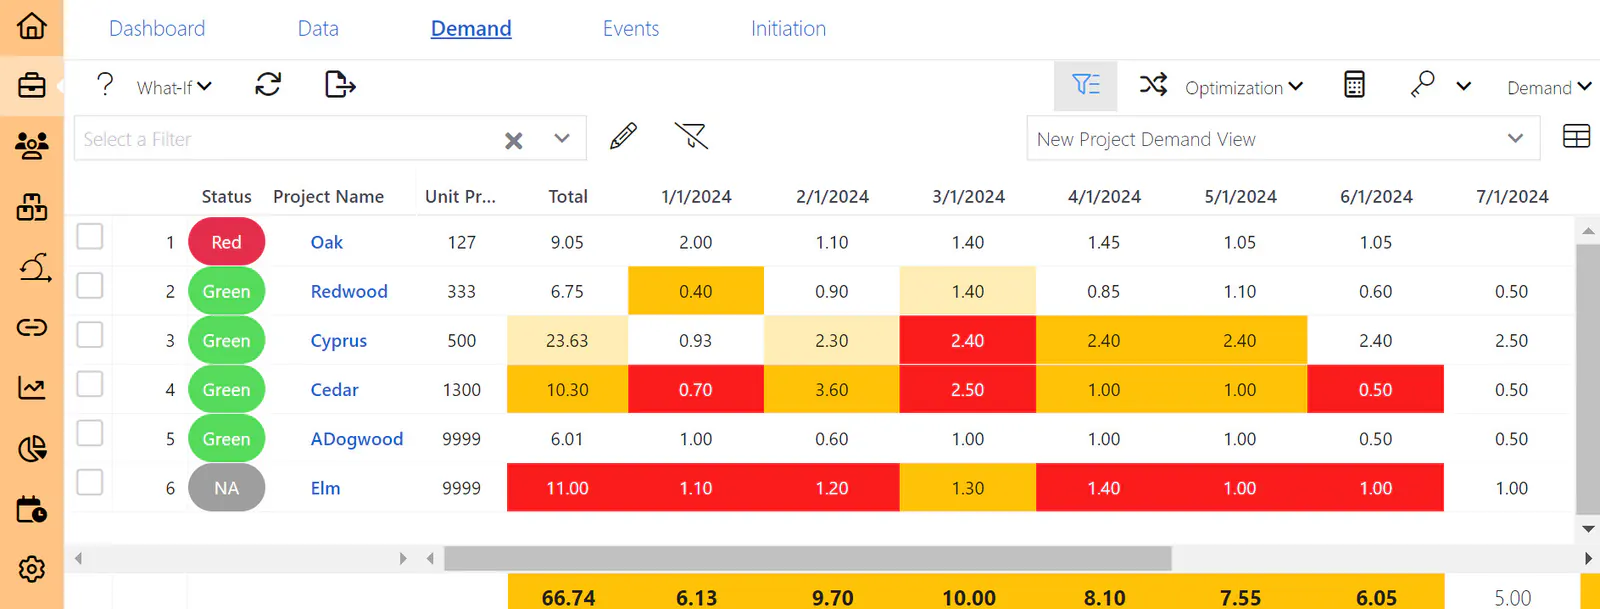
The Demand page shows “supply versus demand” color analysis and provides What-If analysis of changes to the timing of demand or the priority on individual projects.
For projects with unsatisfied demand (shortfall),
What-If Schedule analysis answers the question: “How do changes in demand timing affect the availability of resources for this project?”
What-If Priority analysis answers the question: “How do changes in the priority of this project affect the availability of resources, and what impact would it have on other projects?”
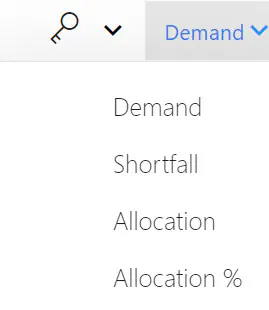
The Demand page can also display four different value types for projects by period.
- Demand (default)
- Shortfall
- Allocation
- Allocation %
To understand these values, see Labor Assignment Overview.
Page Controls
The Demand Page (pictured below) shows projects by priority, along with their associated demand status, with color indicators highlighting exceptions:
View and Filter Controls:

For an overview of view and filter controls, see Using Views and Filters.
Filters – A filter set on this page applies to the Project Data pages as well (and vice-versa).
Views – In addition to at least one administrator-configured view, the user can create personal views for this page.
The remainder of this article will explore the What-If page-specific controls.
Left Controls:
The upper left Page Controls include a What-If button, a Reload button, and an Export button:

The What-if options are discussed below.
Right controls:
To the right of the page, there are several demand-related controls:
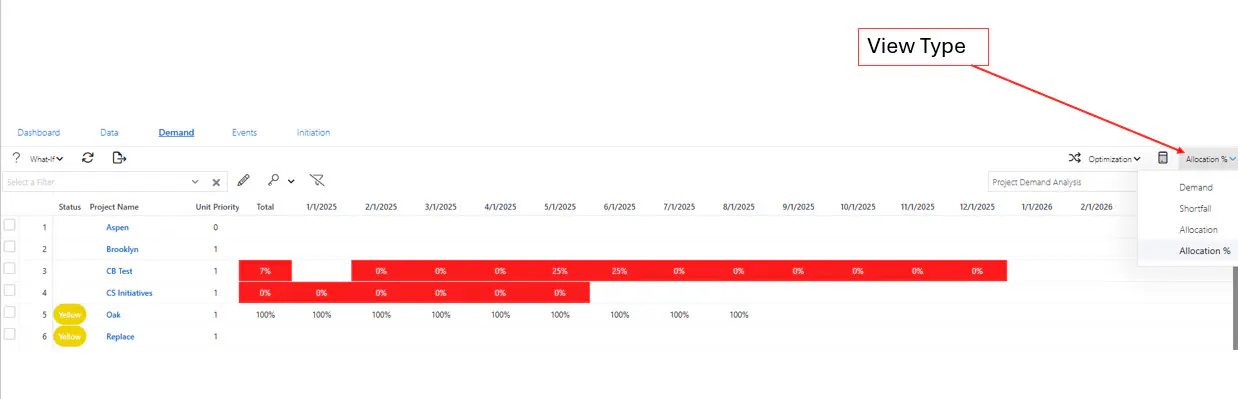
Data Type: Select the type of data to display on the page:
Legend: Display the legend for the allocation colors:
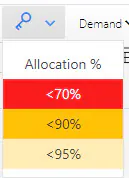
Yellow = 90 – 95% of the needed demand is allocated
Orange = 70 – 90% of the needed demand is allocated
Red = Less than 70% of the needed demand is allocated
(Note: The thresholds are set in Administration > Settings > Algorithms)
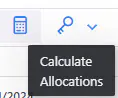
Calculate Allocations: The Calculate Allocations button (calculator icon) recalculates the allocation analysis based on the latest data.
Optimization
Optimization in ResourceFirst refers to the calculation method used to show resource supply-demand analysis issues.
No data is changed with any of the optimization options. The allocation calculation is used to show color in cells where shortfall exceeds allocation thresholds.
The optimization dropdown button controls the calculation method.
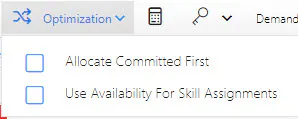
- Allocate Committed First
On (checked): Assignments with committed Assignment State values are allocated before assignments with no value or an uncommitted value.
Off (unchecked): The Assignment State field is ignored.
NOTE: Assignment States are defined in Administration > Other > Assignment States and are used to distinguish states such as “Proposed” vs. “Committed” assignments (sometimes referred to as “Soft Booked” vs. “Hard Booked”).
- Use Availability for Skill Assignments
On (checked): Unused capacity of resources who meet assignment requirements is “allocated” to satisfy demand shortfall for analysis purposes only.
This does not apply to resource assignments with shortfall. only to unfilled skill assignments.
Off (unchecked): All demand on skill assignments is considered shortfall, and allocation % of demand is zero.
For more on the Allocation Algorithm, see Labor Assignment Overview.
Drilling Down into a Project
To drill into a project to see the underlying assignments, click the chevron  to the left of the project name on any row.
What-If Analysis
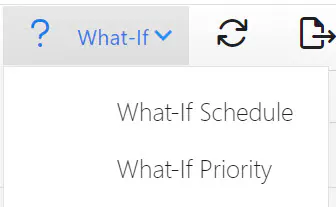
What-If Schedule or Priority analysis can be applied to one project at a time. Use the checkbox at the left of the project row to select the target project.
Note: If you have any skill assignments, be sure to turn optimization on – check the Use Availability for Skill Assignments checkbox. If this is not checked, you get an incomplete and perhaps misleading picture of the effect of making the What-If changes.
What-If Schedule
What-If Schedule simulates moving forecast demand backward and forward in time for as many empty periods as exist to the left and right on current forecast demand. The result is displayed with one row per period moved plus the current (0 movement) row.
If there are no empty periods the simulation displays just one row representing current demand.
Data shift what-if cases can be performed into empty time periods on the left and right of the current data range. If the selected project has demand in the first and last periods, no what-if can be performed.
The What-If data represents the Allocation Percent of Demand (i.e., what percentage of the projects assignments can be allocated).
In the case of the PS Request project with the date range shown, demand can be shifted 6 periods to the right (later). The result will be 7 rows, with shift amounts going from 0 to + 6.
The result appears in the bottom panel of the page. Each row shows the result of a 1 period shift in demand. The number and direction of shift is shown in the Shift column at the far left.
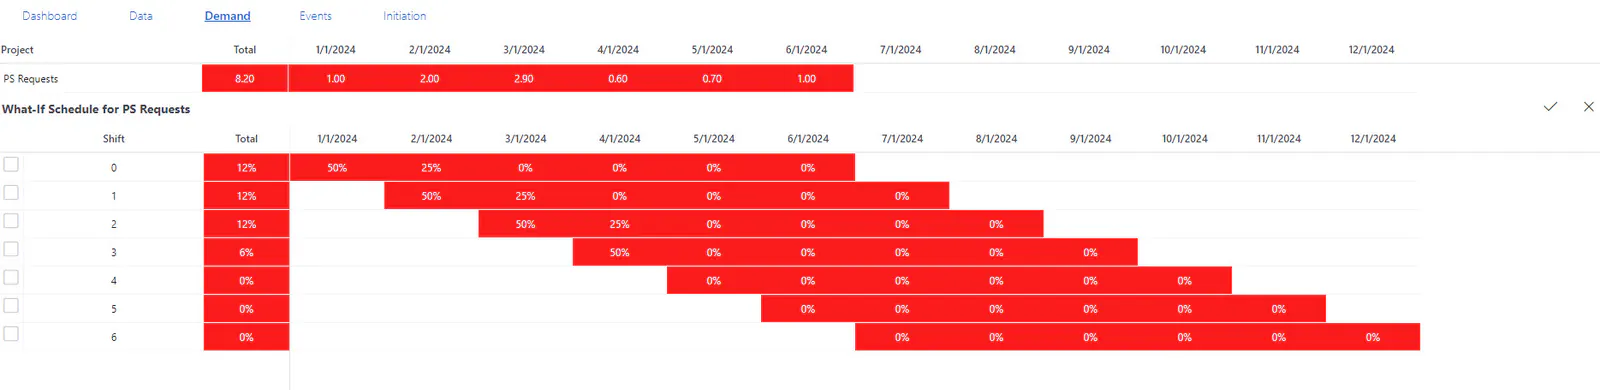
IMPORTANT! In the example above, if the PS Requests project is shifted forward, each shift in time appears to get progressively worse (i.e. resources are even less available and allocation percent is 0). However, this is clouded by the fact that skill assignments, by design, remain unallocated until they are satisfied with named resources. As a result, if a project has skill assignments, the data is not indicative of what “could be” if the skill assignments were filled.
Fortunately, ResourceFirst includes an Optimization feature “Use availability for Skill Assignments,” which will show the data “as if” the skills assignments are satisfied with available resources. The same “What-If” analysis with “Use availability for Skill Assignments” activated, appears below. Now the outlook is a little rosier if shifting the project forward.
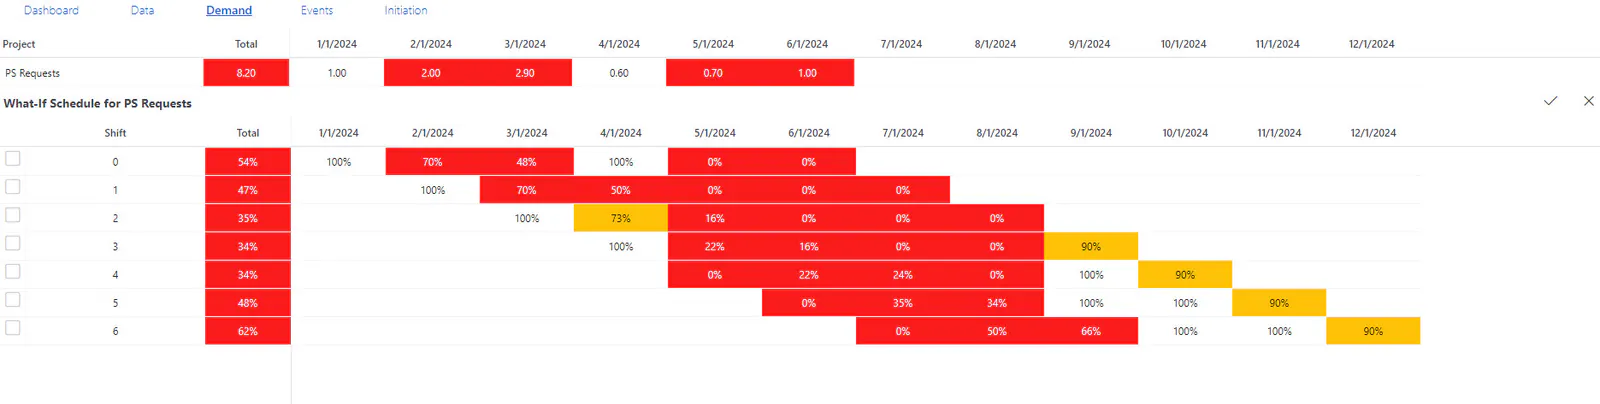
Note: This what-if feature only shows the impact of the move on the selected project. It does NOT show the impact on lower priority projects or on higher priority projects if Allocate Committed First is checked.
Note: If Allocate Committed First is checked, a committed resource assignment on a low priority project can get allocation before an uncommitted assignment of that resource on a high priority project.
What-If Priority
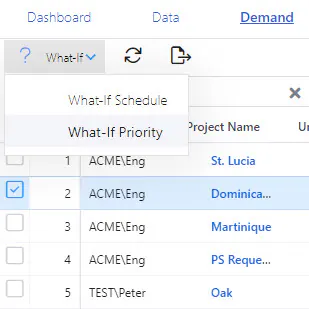
Selecting What-If Priority on the What-If dropdown button after selecting a project enables a simulation of the project being given a higher priority, including the potential impact on the rest of the portfolio.
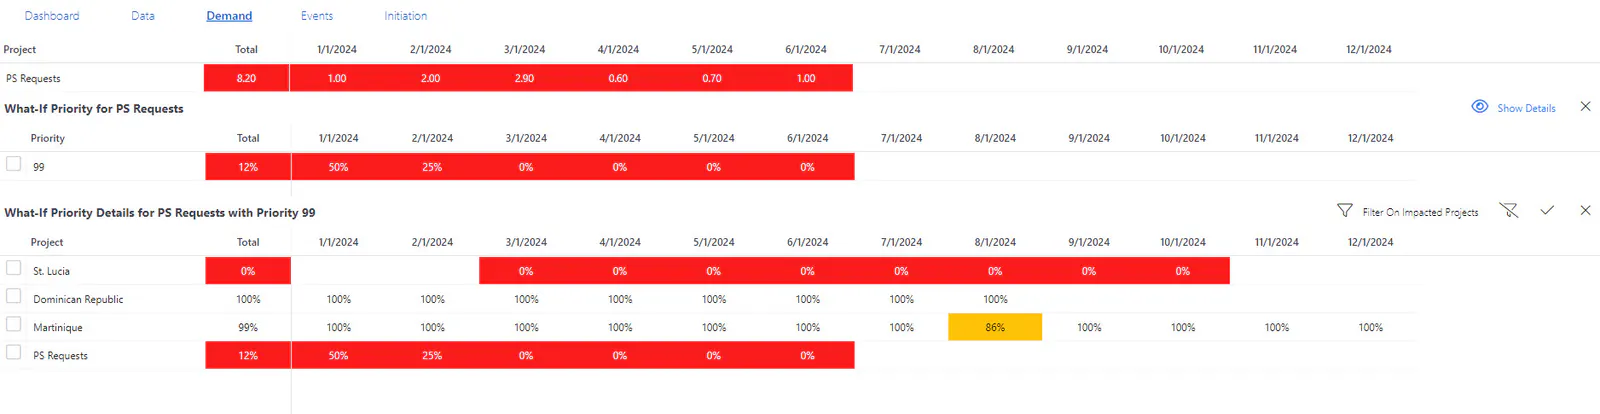
Below is an example of a project (PS Requests) that previously had a priority of 100, showing the allocation percent if the priority were bumped to 99. The bottom tray shows the impact to other projects in the portfolio.
There is also a button on the upper right to “Filter on Impacted Projects” so that only projects that are impacted by the priority shift are shown.
How To
What-If Schedule
Step 1: Select the checkbox next to a project.

Step 2: Click the What-If button and select What-If Schedule.
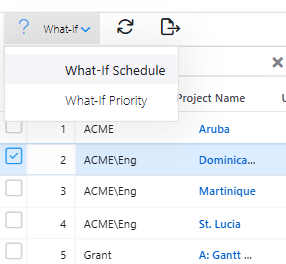
The allocation possible for every one period shift earlier and later of demand on the selected project is displayed in the what-if pane at the bottom of the page.
Step 3: If you wish to see the data “as if” skill assignments are filled with available resources, click the Optimization dropdown and check “Use Availability for Skill Assignments.”
The data will be shown as if skill assignments are filled with available resources:
What-If Priority
Note: The What-If Priority feature shows comparisons in Allocation % format. Therefore, when using What-If Priority, change the Demand view type to Allocation % for a like-for-like comparison.
Step 1: Select the checkbox next to a project.
Step 2: Click the What-If button and select What-If Priority.
The project is shown on the What-If page, along with the allocation percent if the priority were bumped up.

Step 3: Click Show Details in the upper right. A pane will appear below showing the impact to other projects in the portfolio. Click the “Filter On Impacted Projects” button in the upper right to only show projects impacted by the priority change.
To turn off the filter, click the “Clear Filters” button to the right of “Filter on Impacted Projects: