Labor and Financial Waterline Pages
This article describes the common and unique features of the labor and financial waterline pages.
Overview
Waterline pages display a bar or stacked area chart at the top of the page showing the forecast level of labor or financial investment for each project. The supporting data table is below the chart.
ResourceFirst features two Waterline pages, one for labor demand forecast (Waterline) and one for financial demand forecast (Financial Waterline).
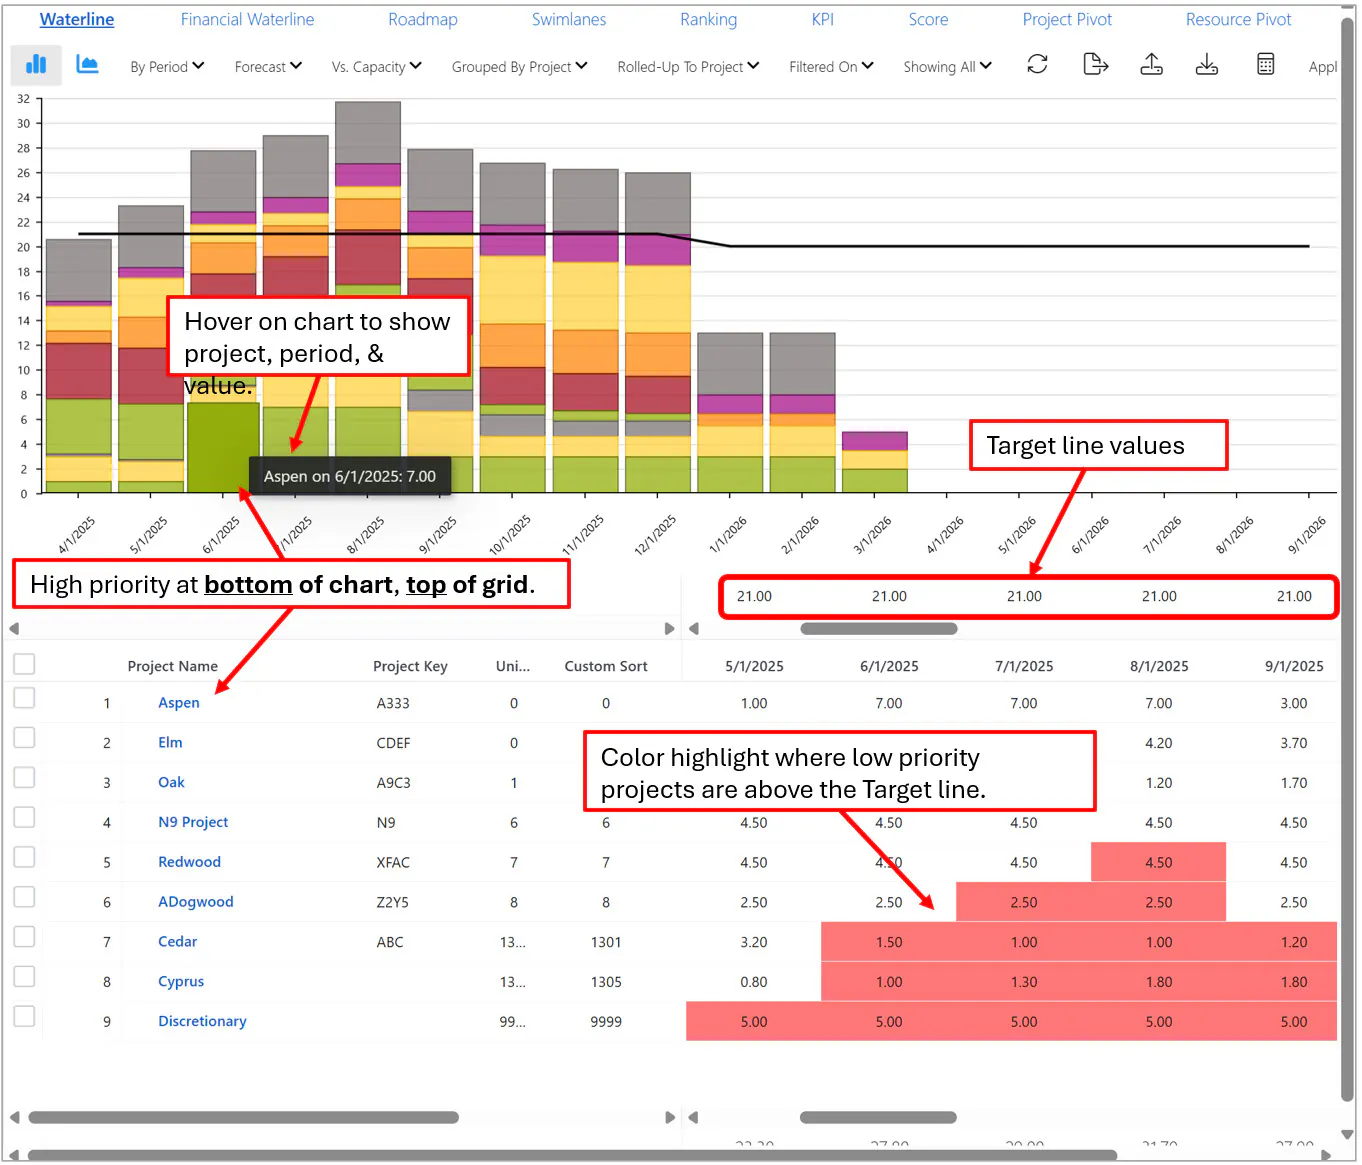
If the organization has set a labor FTE or financial target for the Data Load OBS nodes, these charts can show a line for the target investment (or for Capacity on the labor Waterline page). There is also a Custom option for the user to enter target values in the Target row above the grid.
The grid is sorted initially in priority order, highest priority (priority 0 or 1) on top. The chart is in inverse order, lowest priority (highest number – 9999) on top nearest or over the target line.
Note: The color highlighting (for over target) is based on the priority sort order. Colored cells remain colored when any other sort is applied.
The grid on these pages also has user control columns (Exclude, Delay, Scale %) that show how the portfolio stacks up against the targets if you exclude projects, shift investment forward or backward, or scale it up or down on individual projects.
The (Labor) Waterline page, pictured above, shows resource/skill demand against Capacity (the line).
The Financial Waterline page is similar but shows project financials against the financial Target line.
Waterline Page Options
Both pages provide a (mostly) common set of waterline features/options at the top of the screen.
On the Labor Waterline page only, there is a Grouped By menu and the Chart Line menu has the Capacity option.
Left Side of Toolbar

Chart Type: Bar or Area
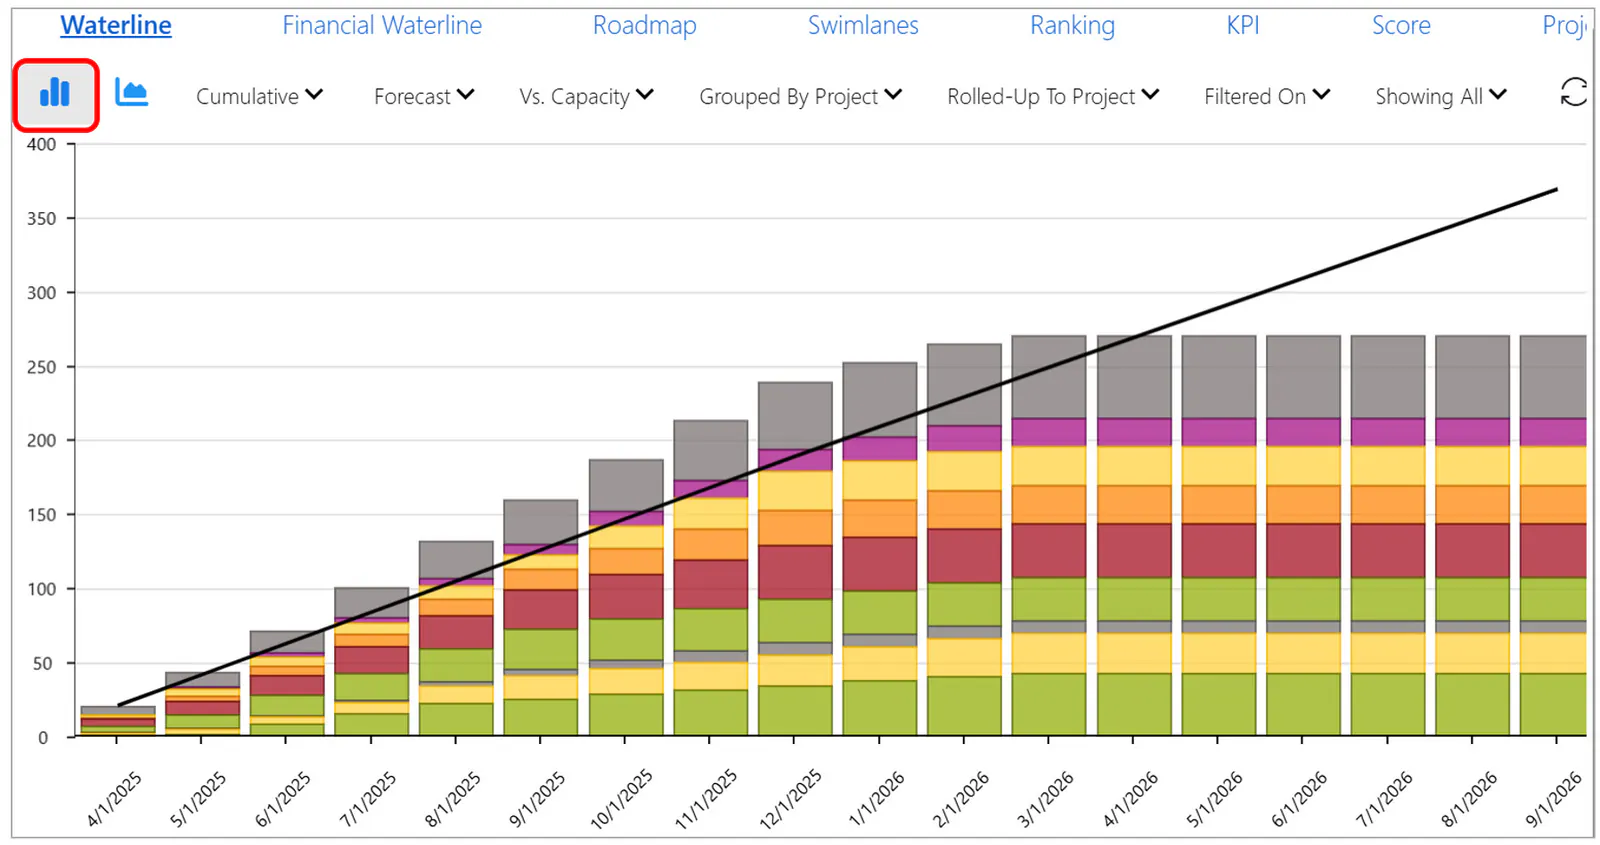
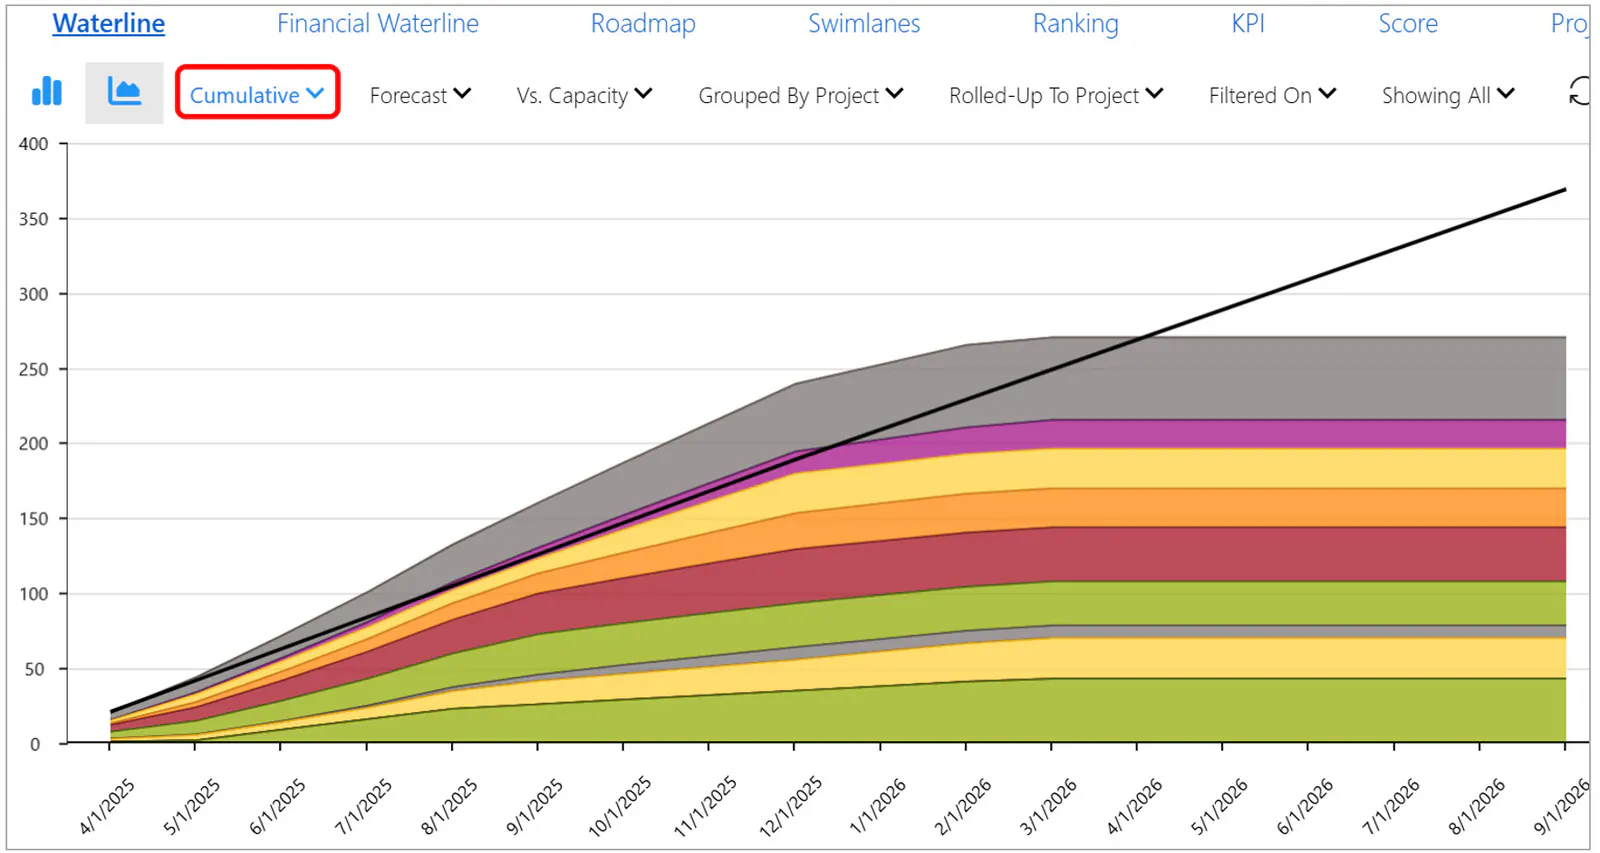
Chart Mode: By Period, Cumulative
Value Type: Forecast or Actual/Forecast
Chart Line: Target or Custom (or on Labor Waterline only, Capacity )
Grouped By: (Labor Waterline only) Project or Skill
Project Hierarchy Rollup: Project, Level 2, Level 3, Level 4 – (Project represents level 1 in the Parent-Child relationship)
Filtered On: (Countries on Labor Waterline ; on Financial Waterline Cost Item Categories: Capital, Expense, Labor, Revenue)
Showing: All, Forecast Only, Scenario Only, Variance, Combined
Menu Text Shows Selection:
All have text that shows the option selected except menus Chart Type (2 icons at the left) and Filtered On.

Mid to Right Side of Toolbar

Reset
Export (Grid)
Save Settings
Load Settings
Calculate
Apply
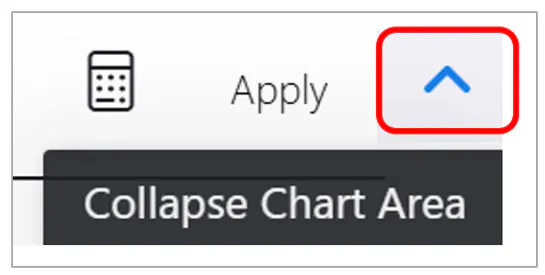
Collapse (/ Expand) Chart Area
Chart Type
Bar or Stacked Area:
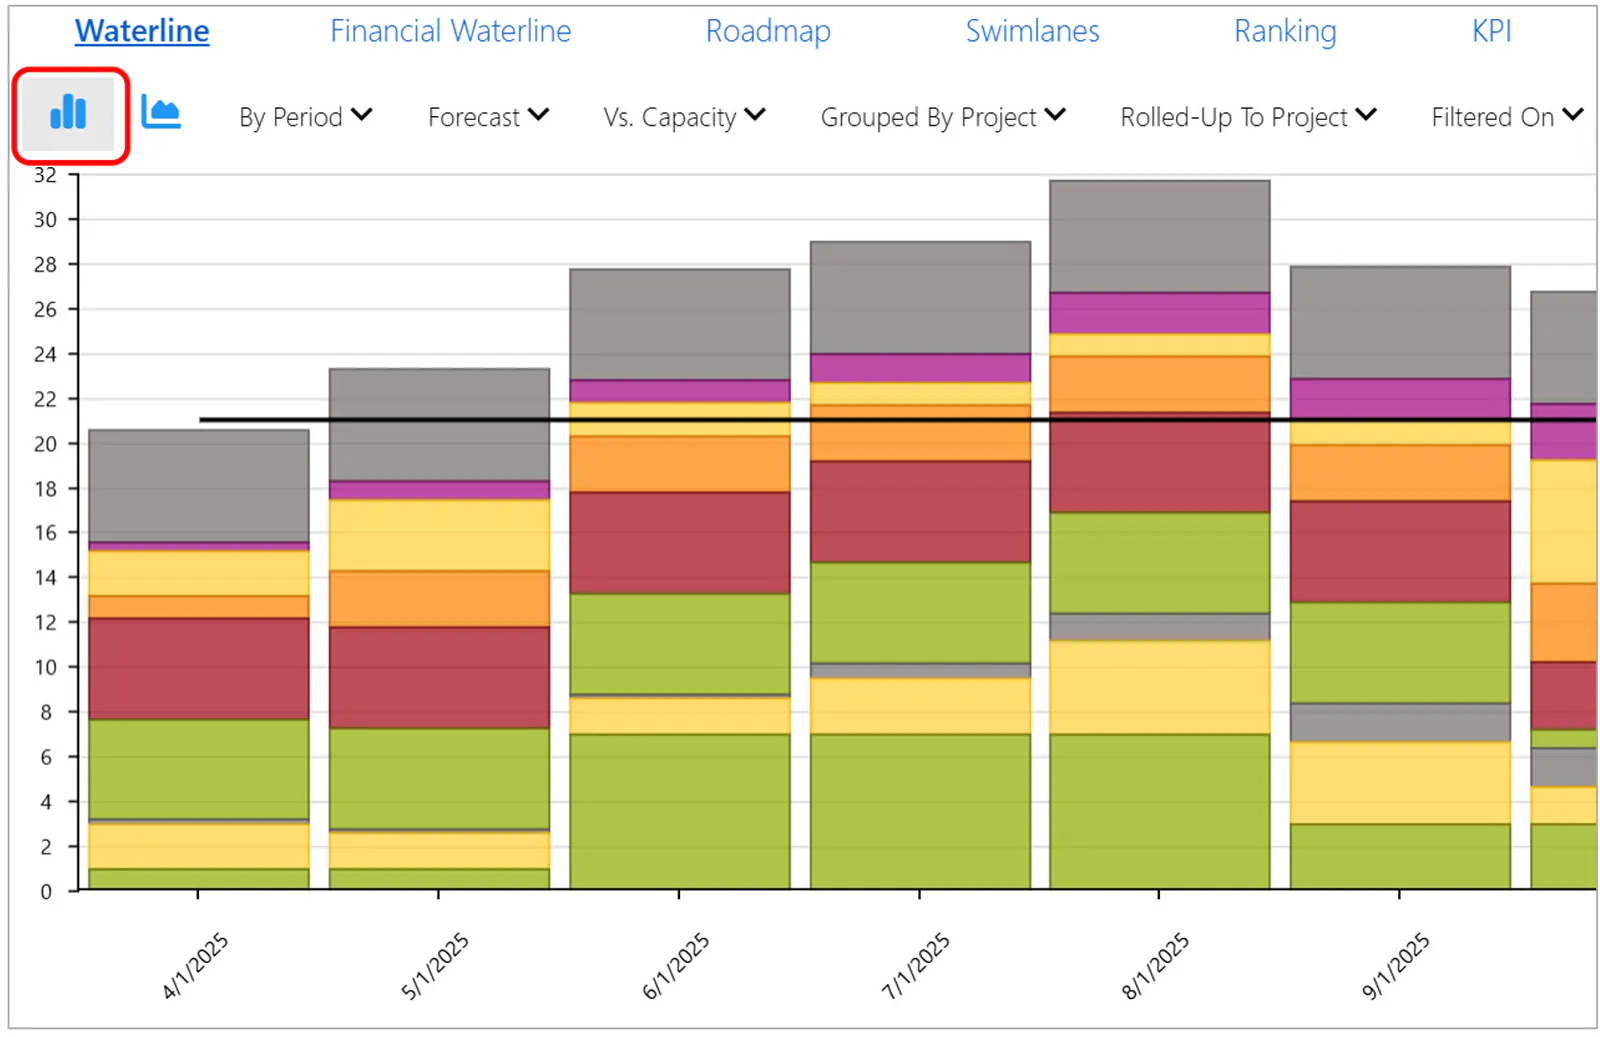
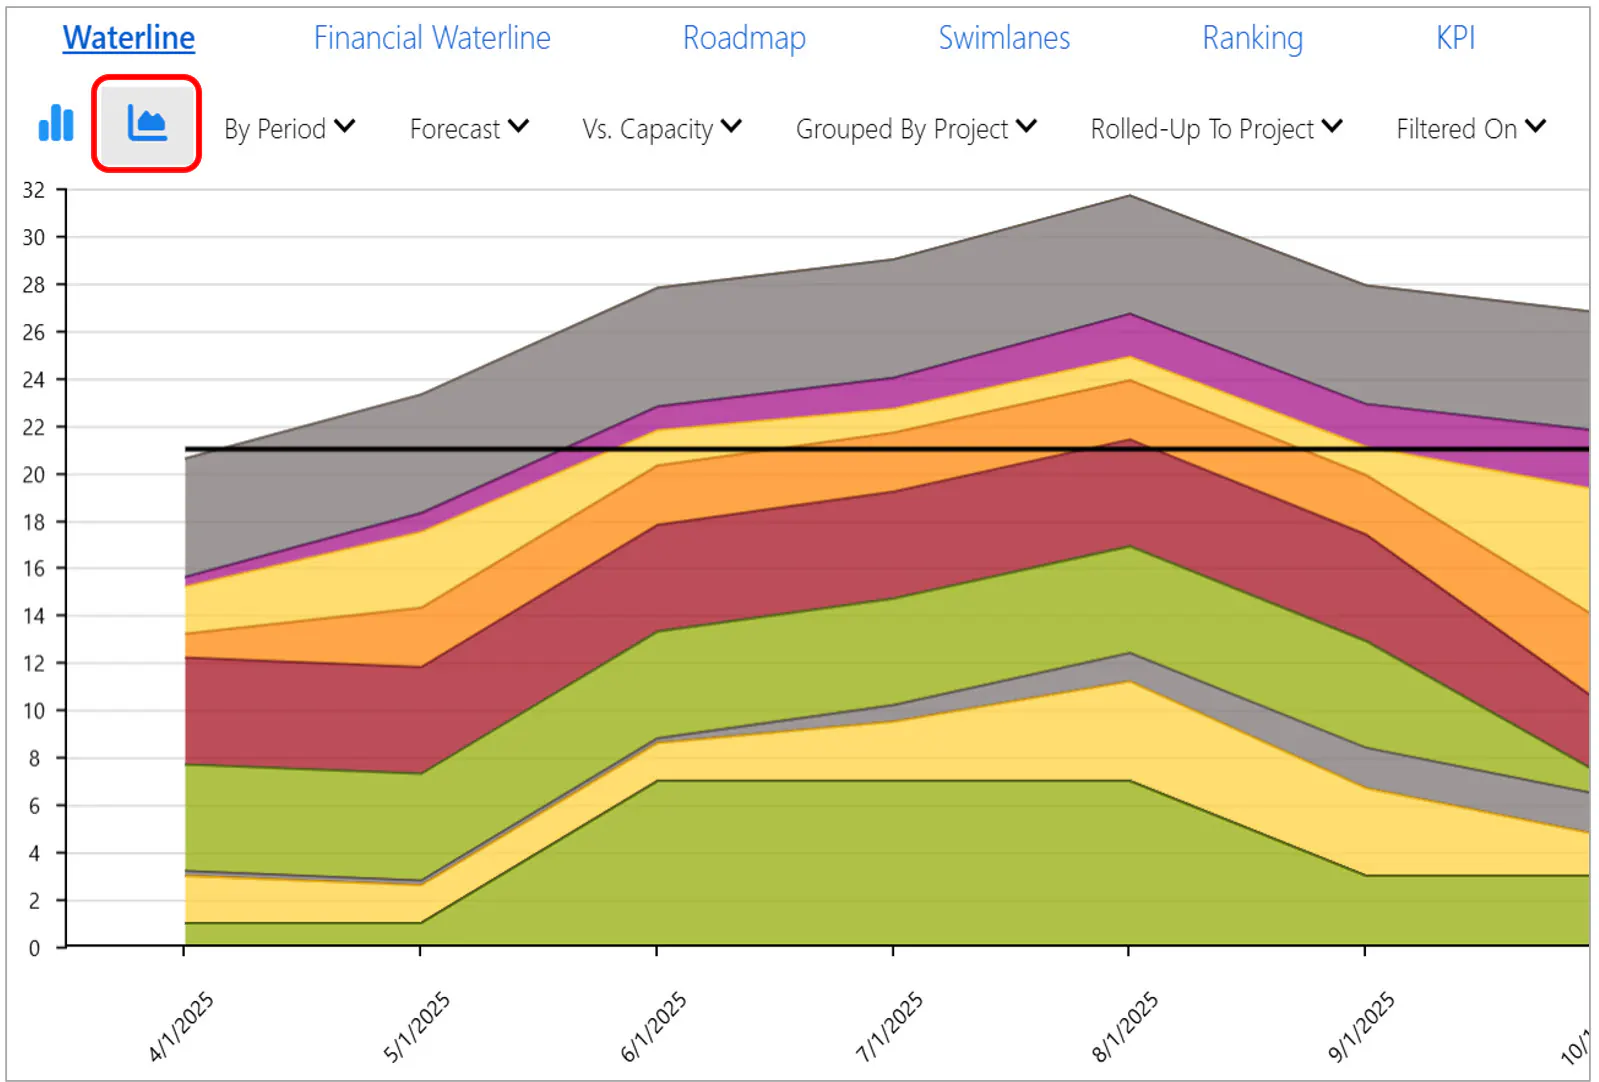
Chart Mode
Period or cumulative:
Cumulative in both Chart Types (Bar Type & Period Mode above)
Value Type
Forecast or Actual/Forecast:
Past periods are populated with actual values (including empty); the period containing the current date forward has forecast values.
Chart Line
Capacity (labor Waterline page only), Target, Custom. If Custom is selected, Target or Capacity numbers are cleared and the user can manually enter a “custom” set of values for the measurement line in the chart.
Grouped By
This option is available on the labor Waterline page only. This provides an option to group the chart by project or by skill.
The Skill choice has no effect on the grid rows and has no relationship with project priority. The Skill grouping can show the timing and relative scale of skill demand.
Project Hierarchy Rollup
[To be added.]
Filtered On
On the Labor Waterline page, the Filtered On list has Countries; on the Financial Waterline page it has Cost Item Categories – Capital, Expense, Labor, and Revenue.
Showing
Selection of an option defines the data included in the grid and the chart on the Waterline page.
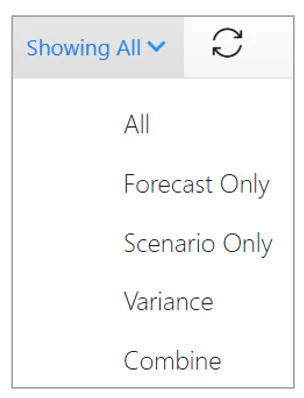
All – Total of all forecast and scenario projects.
Forecast Only – Include all forecast records, ignore all scenarios.
Scenario Only – Include all scenario records, ignore all forecasts.
Combined – Display source projects only. Source project values are replaced by scenario project values.
The portfolio appears as if all scenario projects currently visible had been posted into source projects (on the waterline page only).
[Note: Assignments added to the source project after creation of the scenario but NOT added to the scenario are not accounted for by this method.]
Variance – Difference between scenario projects and their corresponding source projects (scenario minus source).
Where a scenario project is using more resources or spending more money, the variance values are positive.
See the article Using Scenarios on Waterline Pages for more detail on this feature.
Reset
Reset restores modified grid and target row cells to their original values, and clears all Waterline demand modifiers in the left pane of the grid (Exclude, Delay, Scale %).
Export (Grid)
Export the grid with the values currently on the page, including the demand modifier fields (Exclude, Delay, Scale %).
Save and Load Settings
Save Settings
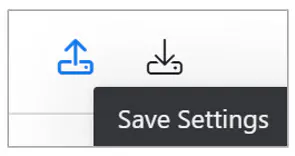
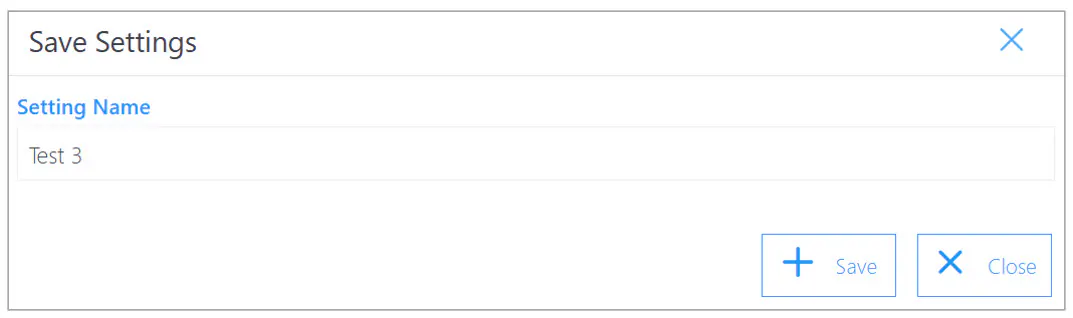
Save Settings saves under the name given in the dialog the current state of the primary waterline options including:
- Menu options
- Demand modification options (Exclude, Delay, Scale %)
Does NOT include:
- Modifications to the custom target row values
- Modifications to grid period data cell values
Load Settings
Applies the selected saved settings.
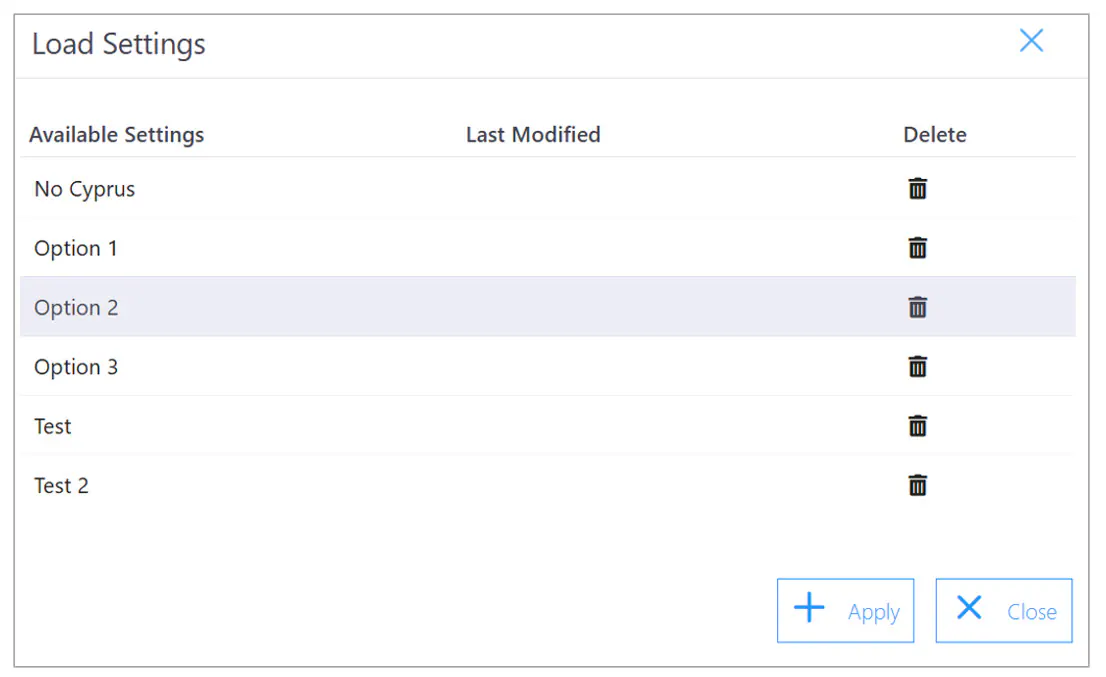
Delete Settings
Click the trash can icon at the right of the settings row.
Calculate
TBA
Apply
Apply Waterline Changes to the current forecast.
WARNING: “Apply” applies only to a single data type, labor or financial, and doesn’t affect project dates (start, finish, or phase/milestone).
This feature should not be used in a production environment where there is a risk that the results of Apply might be saved to the database with some project data in an inconsistent state.
To apply your currently loaded changes to the source projects, click the Apply button next to the Recalculate button.
Exclude – marks the project as inactive but has no effect on assignment demand forecast.
Delay – moves labor/financial assignment values back or forward by the specified number or periods.
Scale – applies the scale factor to the labor/financial assignment values.
WARNING: Scaling does NOT consider resource type; resource assignments are scaled the same as skill assignments or team assignments. This can produce invalid resource assignment values.
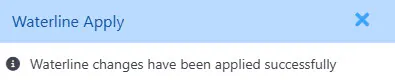
An information dialog is displayed:
Collapse or Expand the Chart Area
The Chart Area takes up quite a bit of screen real estate at the top of the page. You can hide the chart area to avoid scrolling the grid when modelling portfolio cases with the three grid control columns (Exclude, Delay, Scale %).
To collapse/expand the chart area, click the Collapse/Expand Chart Area icon next to the Recalculate and Apply menus at the right of the page toolbar.
Create Waterline Portfolio Models
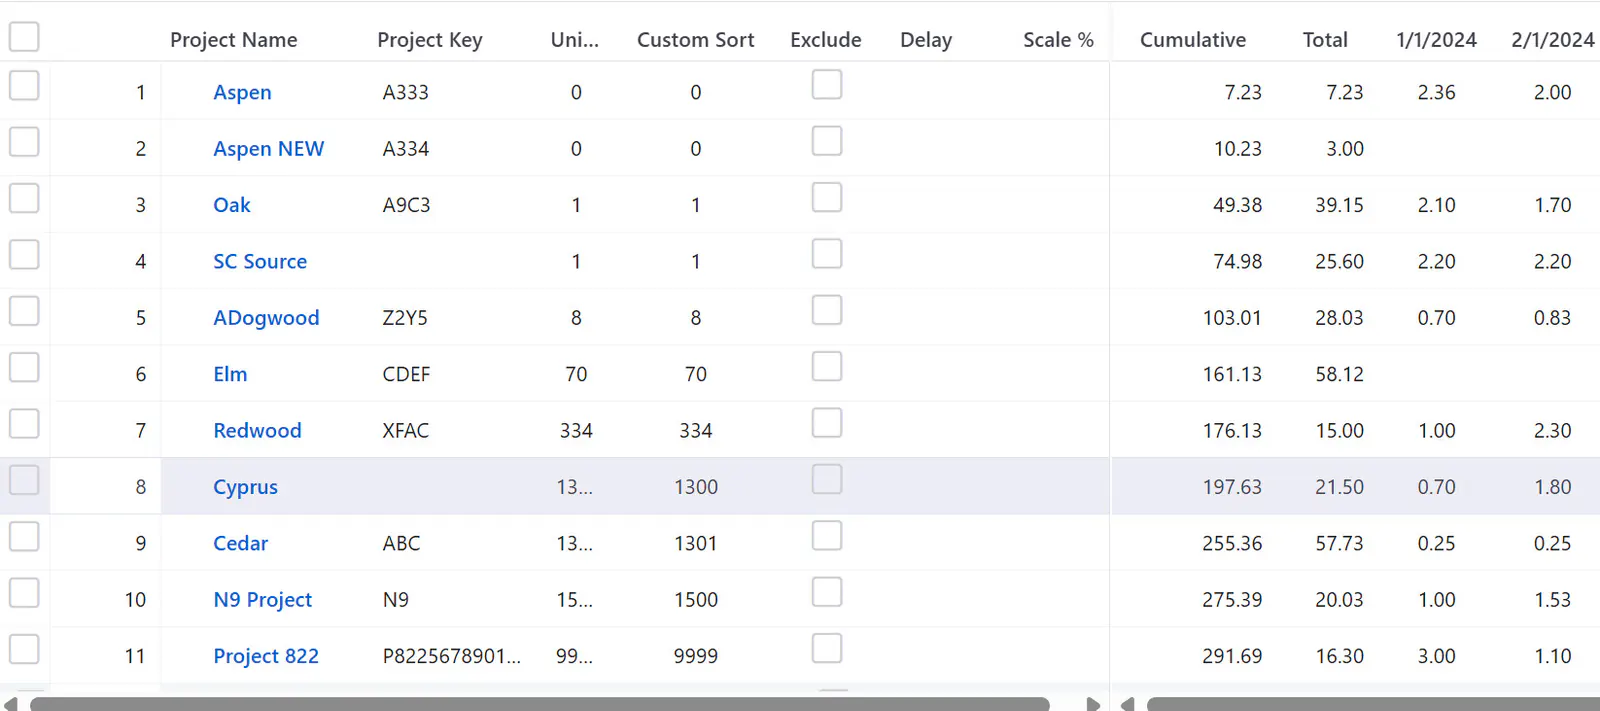
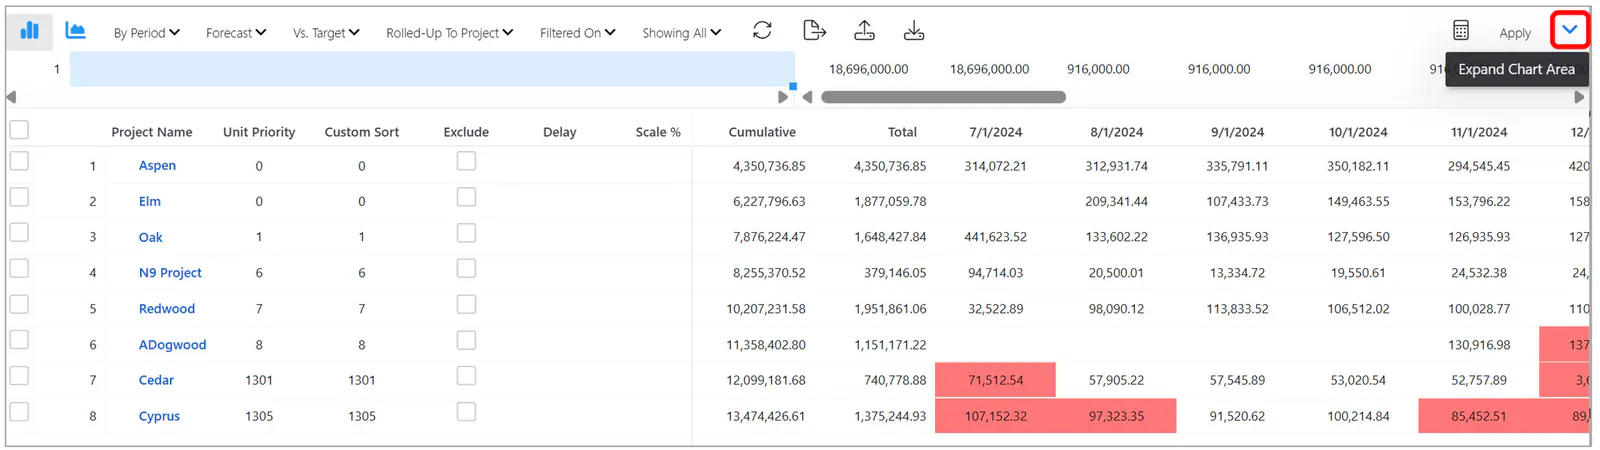
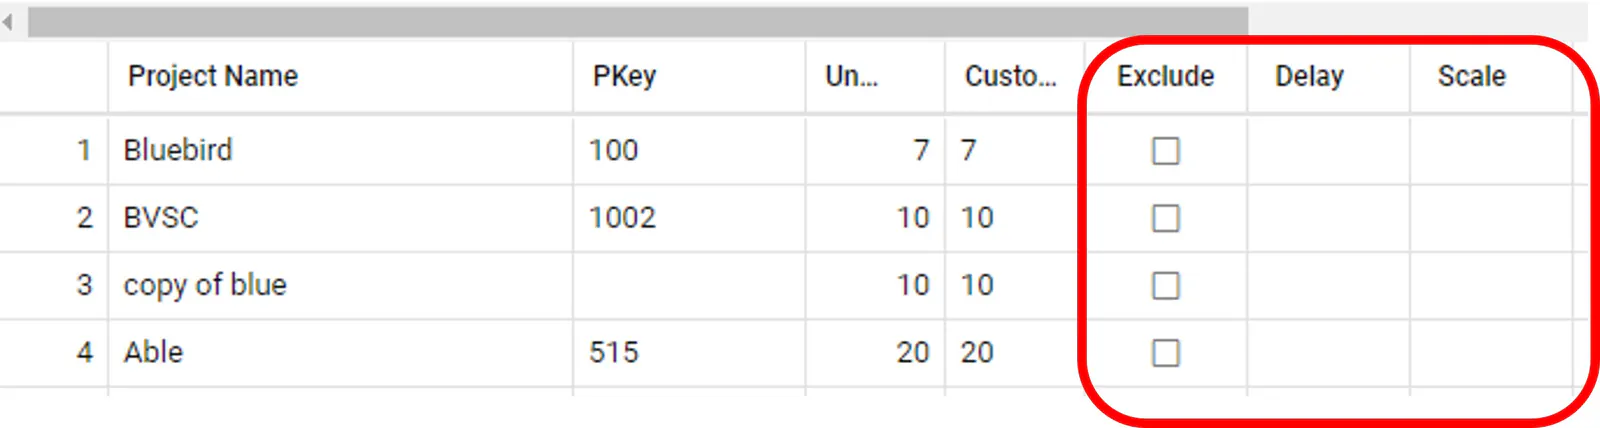
The table below the chart (pictured above) shows effort or cost by period and provides three manipulation columns to the left of the numbers (closeup view below):
Exclude – If checked, the effort or cost for this project is omitted in the chart.
Delay – If a positive or negative integer is present, move all effort/spending forward or backward by the specified number of periods.
Scale – If a positive or negative percent value is present, multiply every period value by that percent.
To clear all project adjustments, blank out the adjustments you made and click the Recalculate button again, or simply refresh the browser or go to another page and return.
Show and Plan to a Target
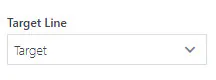
To set a reference target effort or spending line, select “Target” in the Target Line option in the Waterline Options pane to the right.
If Labor or Financial Targets have been defined (via the Assignment area’s Labor Target and Financial Target pages) for the respective OBS nodes in the current Data Load Parameters selection, the target line will appear on the chart at the top and the target effort or spend amounts will appear above the table grid for the respective periods.
For the effort Waterline Page, if Capacity is chosen as the Target Line instead of a defined target, then capacity will appear as the target line.
Important: If using a Target line, be sure to set your OBS filters in the Data Load Parameters to the level at which targets have been defined. Waterline data is dependent upon the Data Load Parameter settings.
In the example below, the Target Line is set to Capacity, so the black line on the chart represents capacity, and the capacity numbers appear just above the table grid periods.
The underlying projects can be manipulated (via exclude, delay, or scaling up or down) to accommodate the target or capacity.
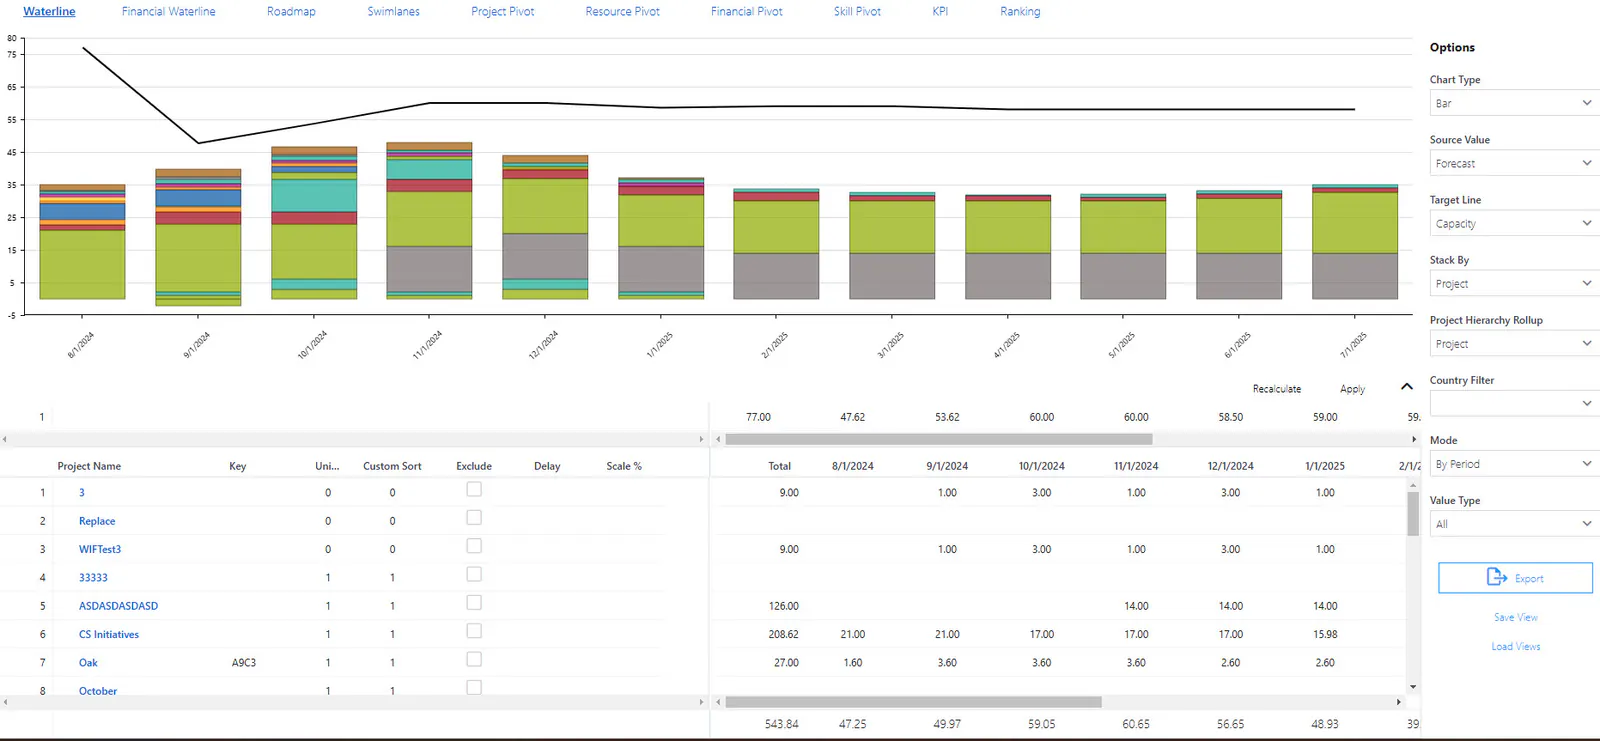
Note: If there are any periods where the total exceeds the target, cells that are above target from the bottom of the priority list up are highlighted to show violations.
Apply Waterline Changes to the Database
WARNING: “Apply” applies only to a single data type, labor or financial, and doesn’t affect project dates (start, finish, or phase/milestone).
This feature should not be used in a production environment where there is a risk that the results of Apply might be saved to the database with some project data in an inconsistent state.
To apply your currently loaded changes to the source projects, click the Apply button next to the Recalculate button.
Exclude – has no effect on Apply.
Delay – moves labor/financial assignment values back or forward by the specified number or periods.
Scale – applies the scale factor to the labor/financial assignment values.
WARNING: Scaling does NOT consider resource type; resource assignments are scaled the same as skill assignments or team assignments. This can produce invalid resource assignment values.
An information dialog is displayed: