Pivot Tables
This article shows how to use the project, resource, financial, and skill pivot pages to summarize and structure labor and financial forecast, baseline, and actual data.
Overview
ResourceFirst provides four Pivot pages that allow you to customize data presentation at multiple data levels.
- Project Pivot shows project assignment forecast, actuals, actual-forecast, cost, and baseline
- Resource Pivot shows resource level capacity, utilization, forecast, actuals, and more
- Financial Pivot shows financial cost forecast, actuals, actual-forecast, and baseline
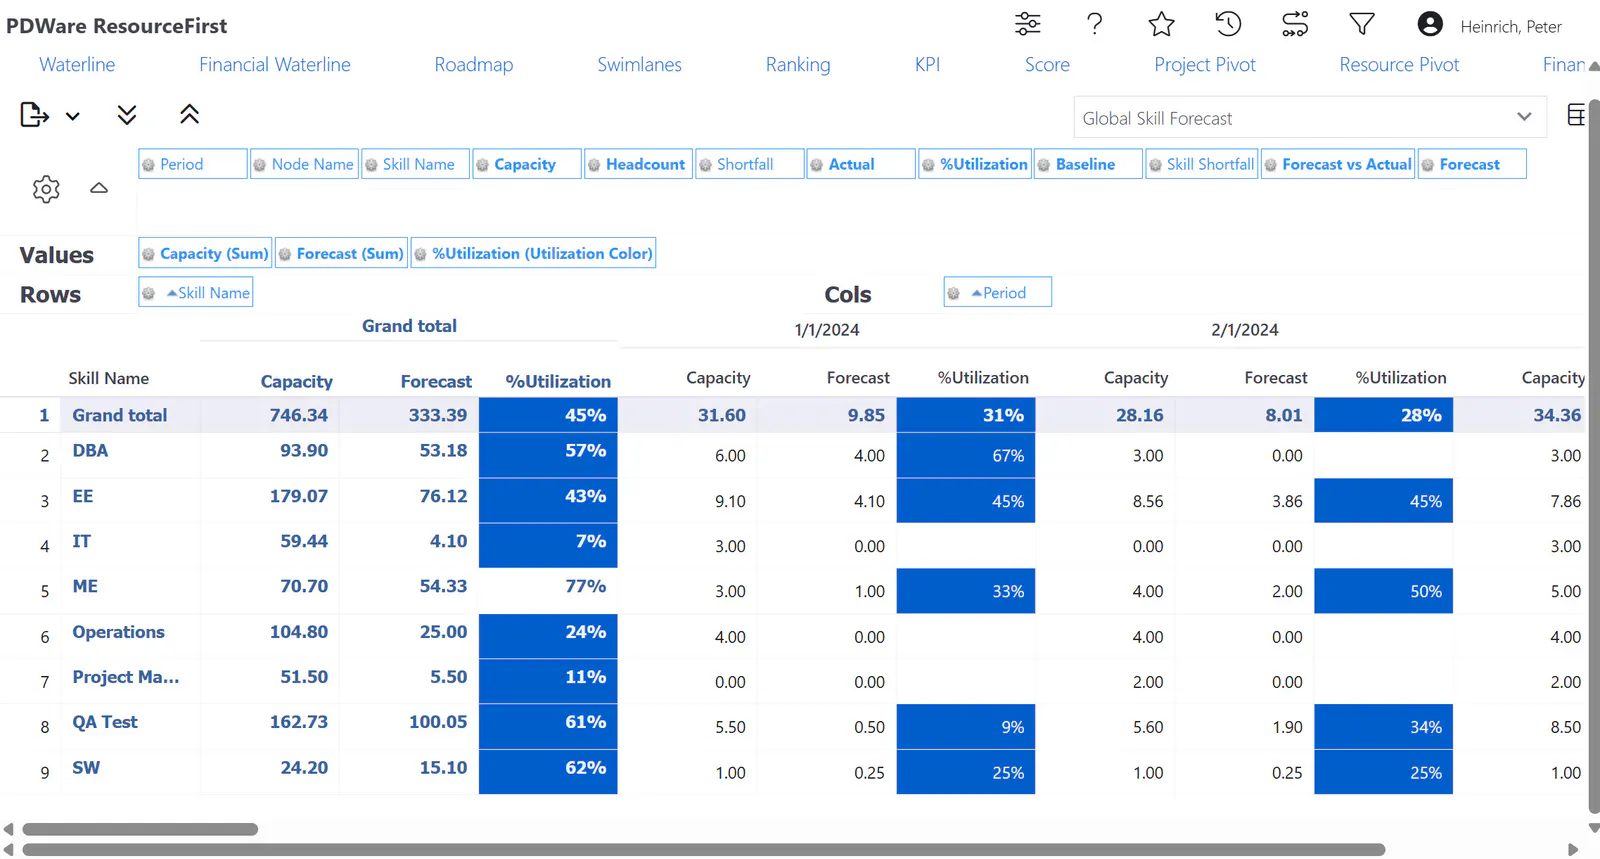
- Skill Pivot shows skill level capacity, utilization, forecast, actuals, and baseline
How To
Access Pivot Pages
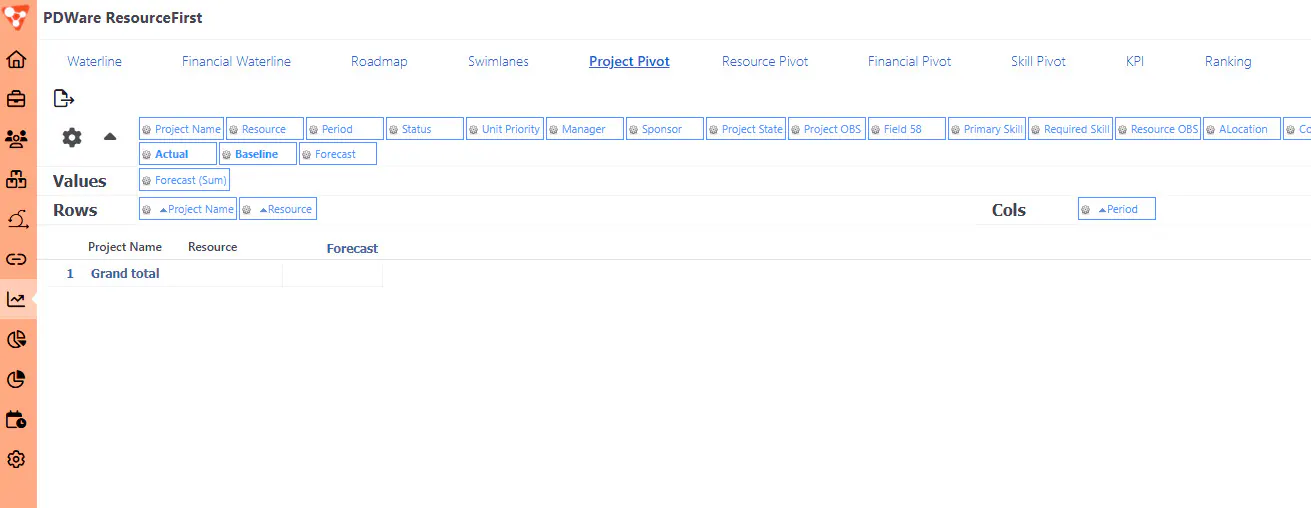
Click on the Analysis icon  on the main menu column. The four Pivot pages are on the page menu at the top of the screen.
Create the Pivot Report
The Pivot field selection consist of three rows:
- Field Selection List
- Values to show in columns
- Rows and Cols: the fields to show on rows and the type of columns
To create the Pivot report, drag the desired fields from the Field Selection List down to the Values, Rows, and Cols areas. In the example below (the Project Pivot), the Values are Baseline. The Rows include Required Skill and Project Name and Cols is Periods.
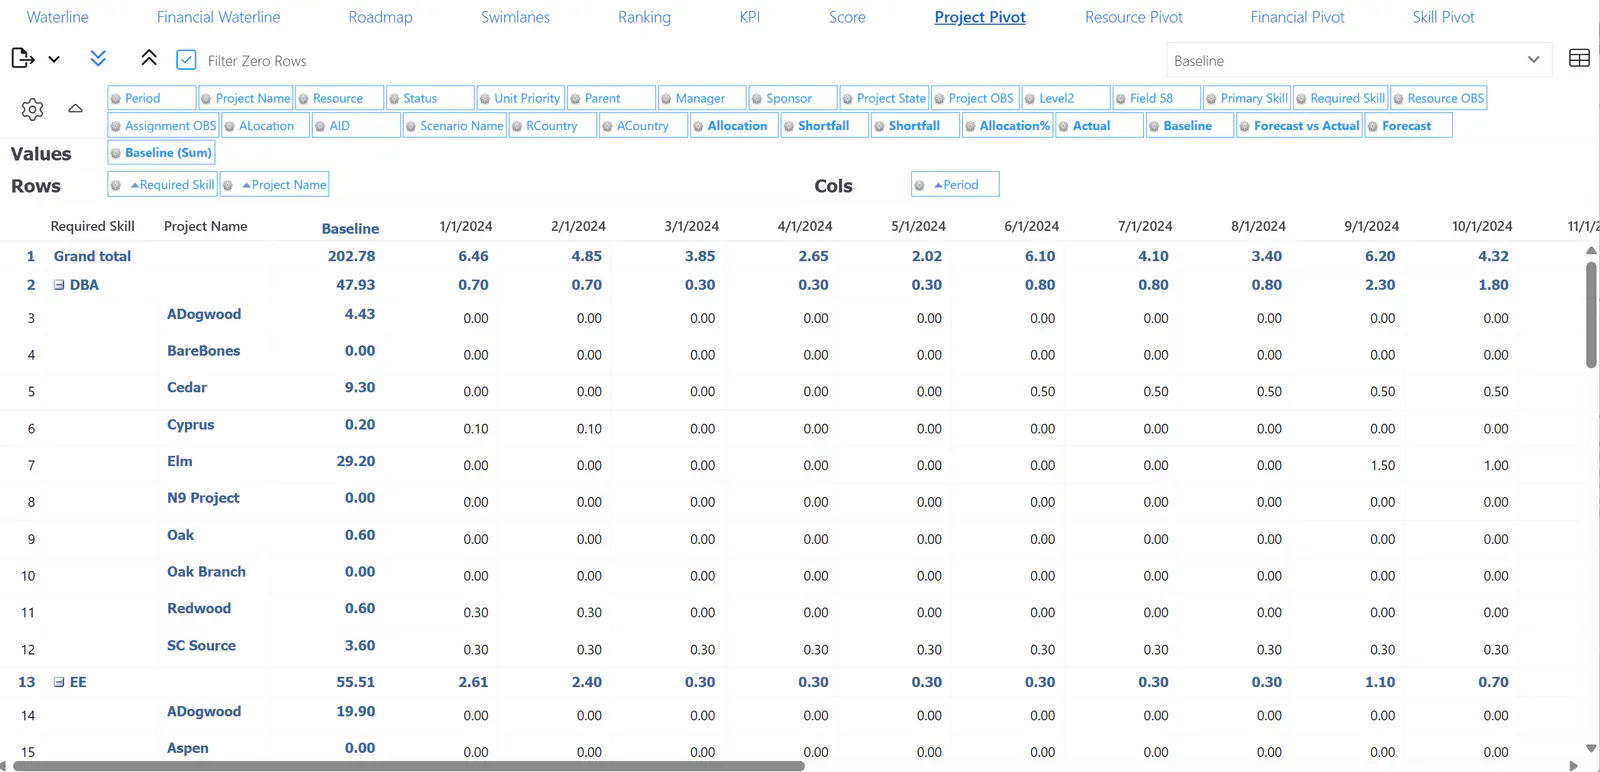
Expanding and Collapsing a Row: Click the + on a row to expand the row; click the – on a row to collapse the row.
Removing Fields from the Pivot: Drag the field back up to the field section list.
Use the Pivot Controls
All Pivot pages have similar controls.
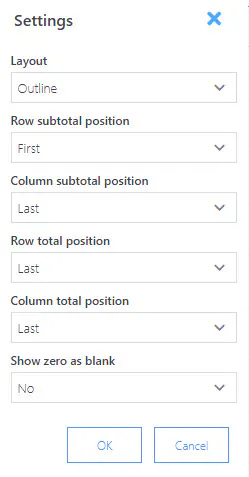
In the upper left Page toolbar, the Settings icon (gear)  presents a dialog where you can customize how you want the Pivot to appear.
Hiding and Expanding the Pivot Controls
The triangle just to the right of the Settings icon hides (collapses) the Pivot controls.

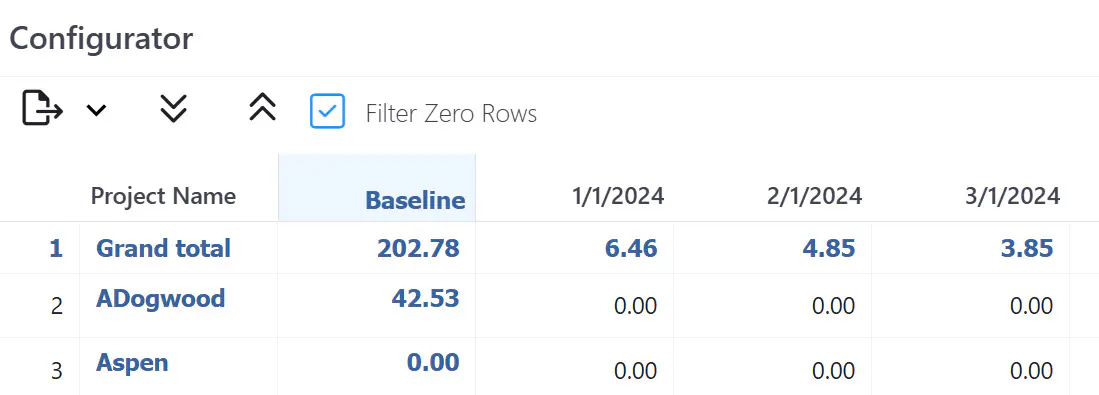
To unhide (expand) the controls , click the down arrow at the far right of the page.


Exporting the pivot to an Excel spreadsheet
Click the export icon above the settings button.
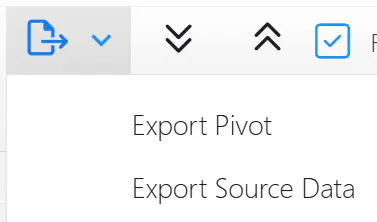
Export Pivot Result
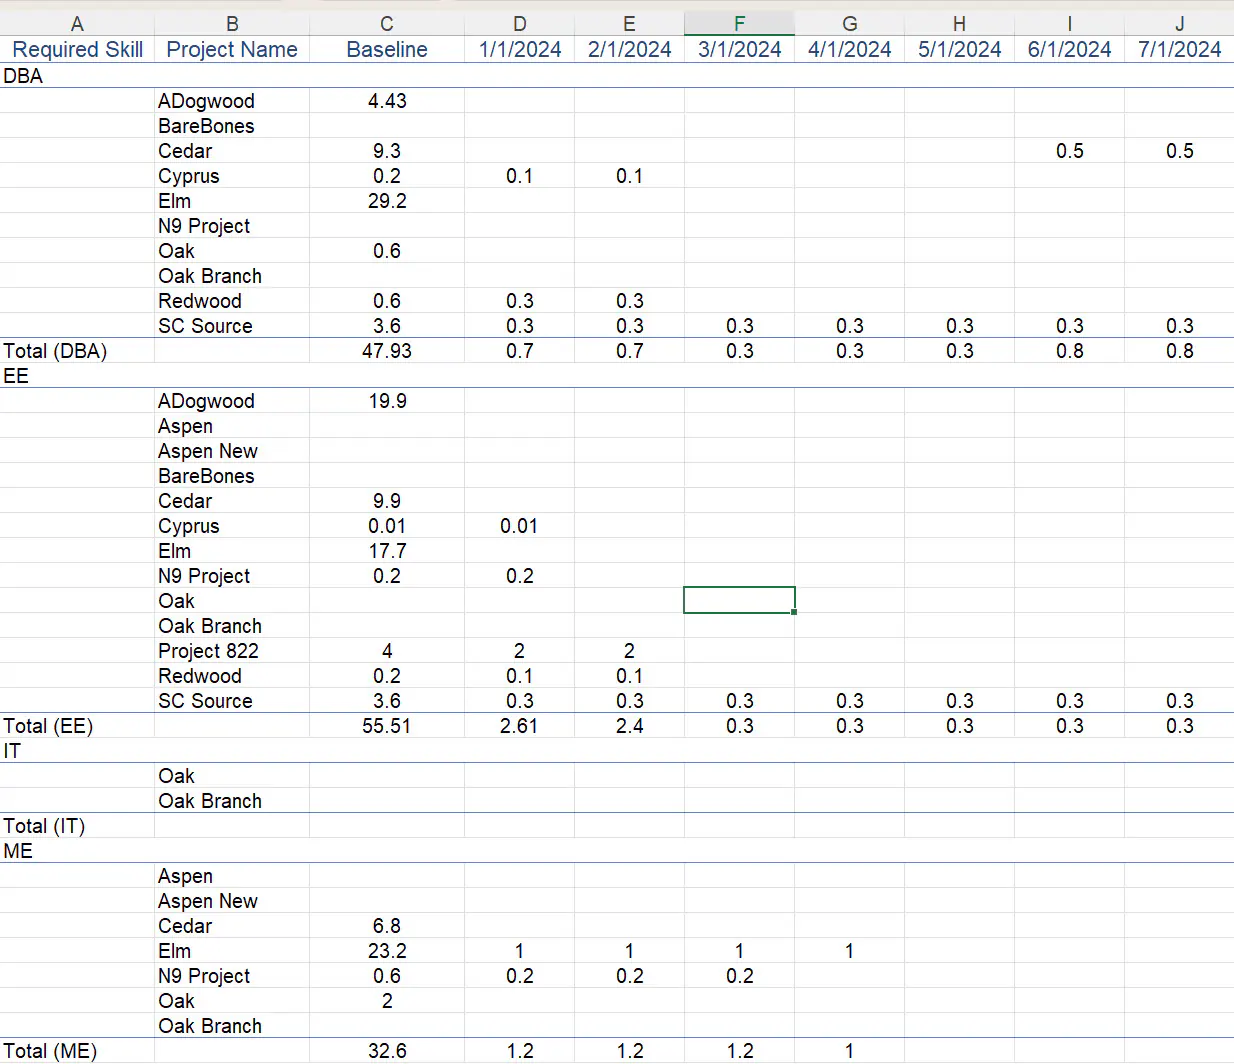
Export Source Data Result

Expand Rows
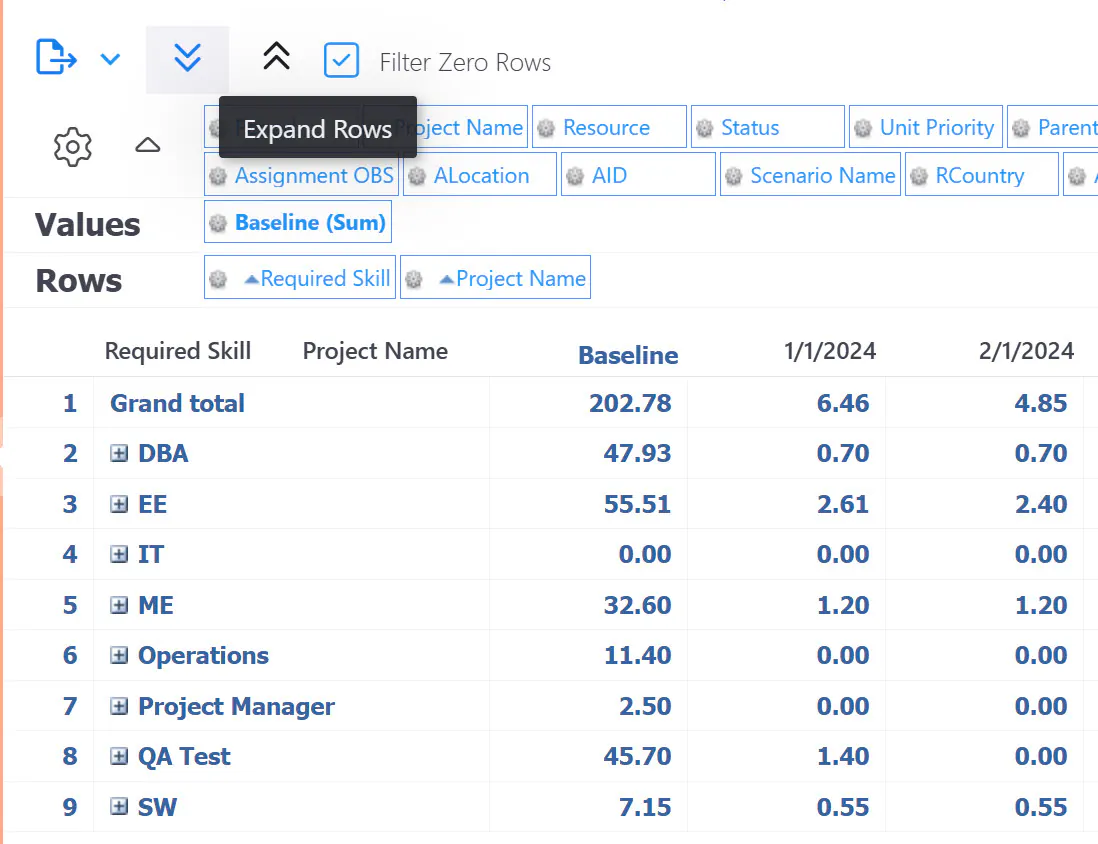
Collapse Rows
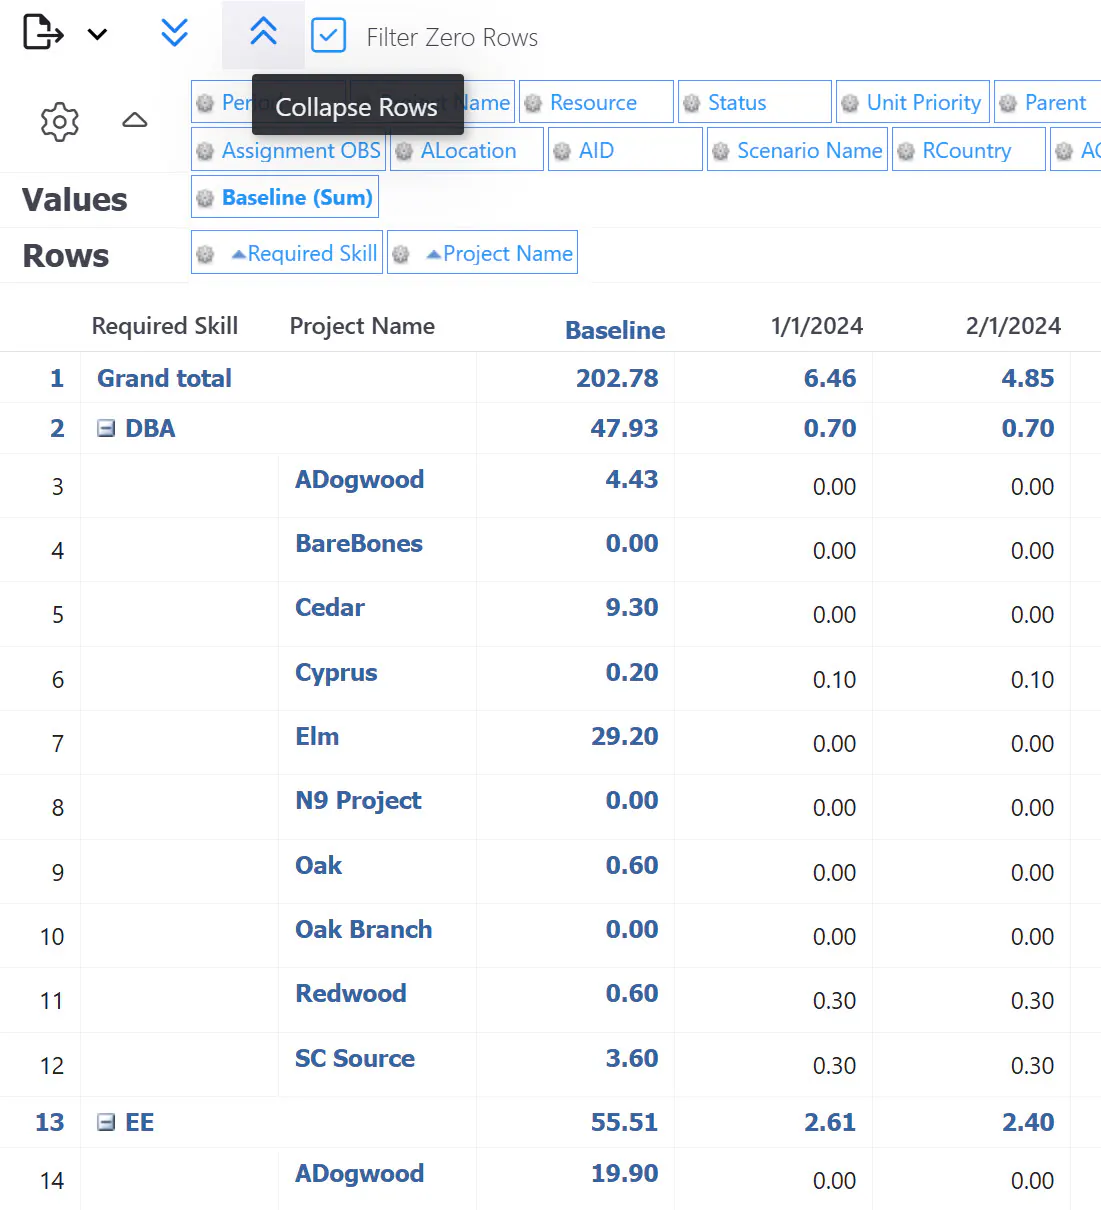
Other Pivot reports include the Resource Pivot, Financial Pivot, and Skill Pivot. All are pictured below:
Other Pivot Examples:
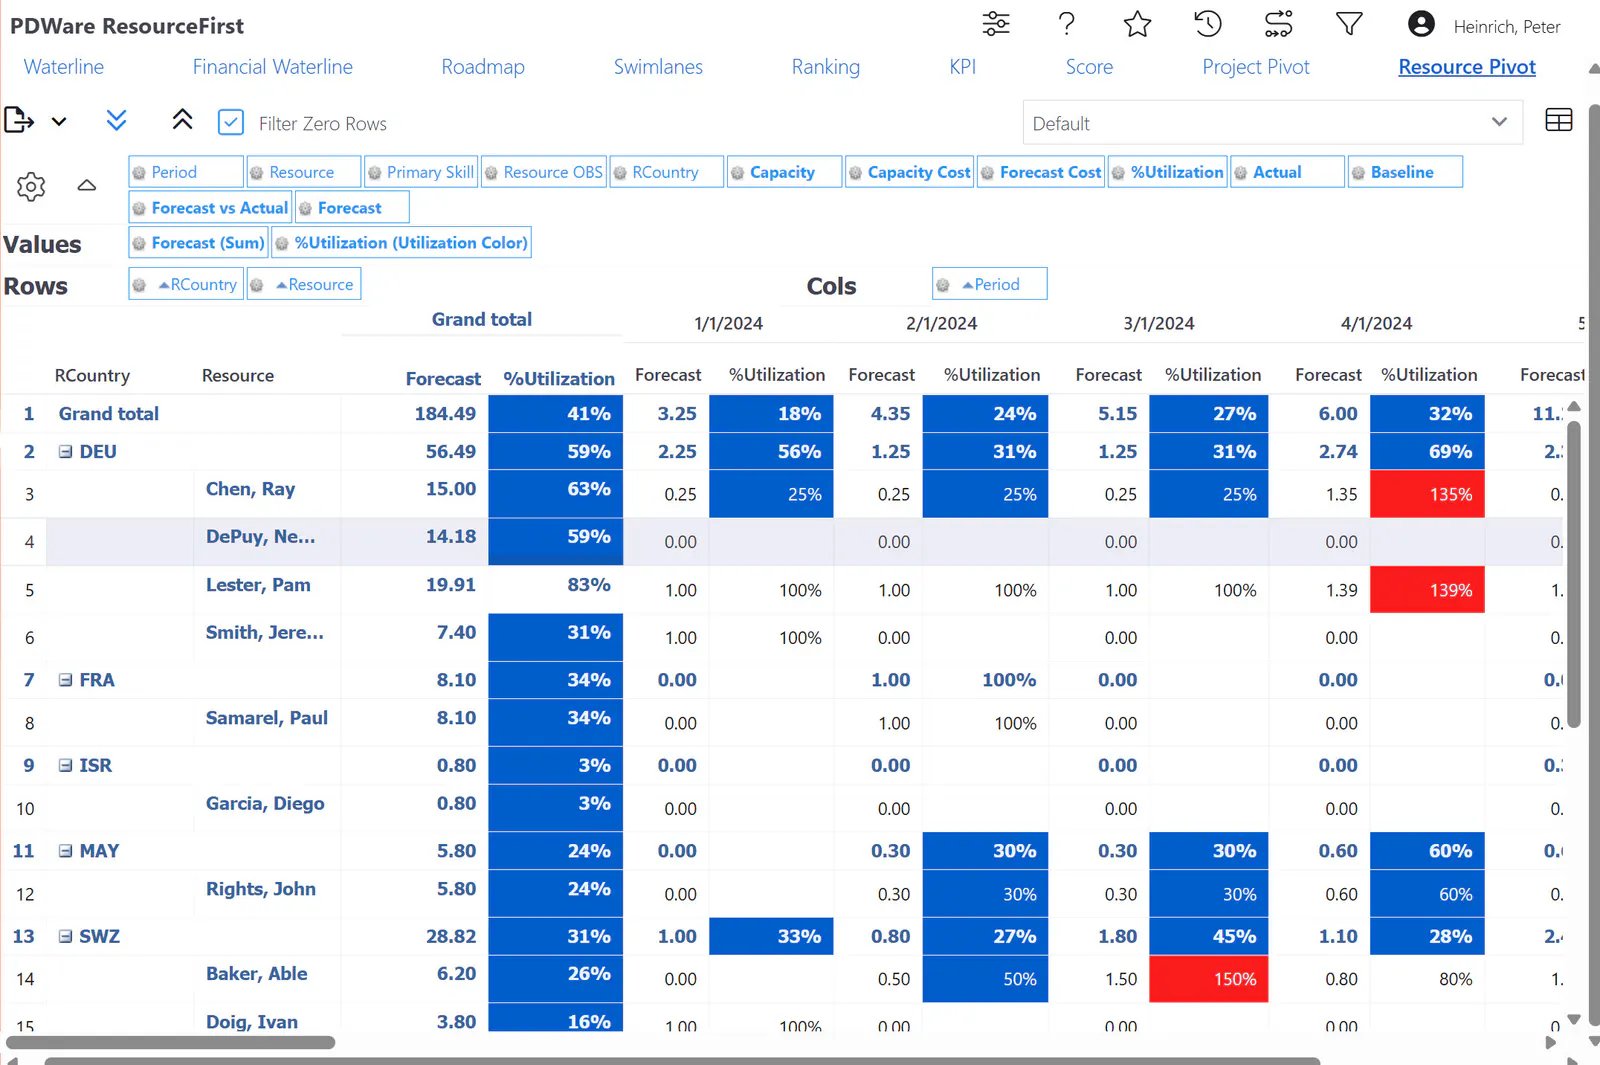
Resource Pivot
The example below shows Forecast and Utilization % by Country and Resource.
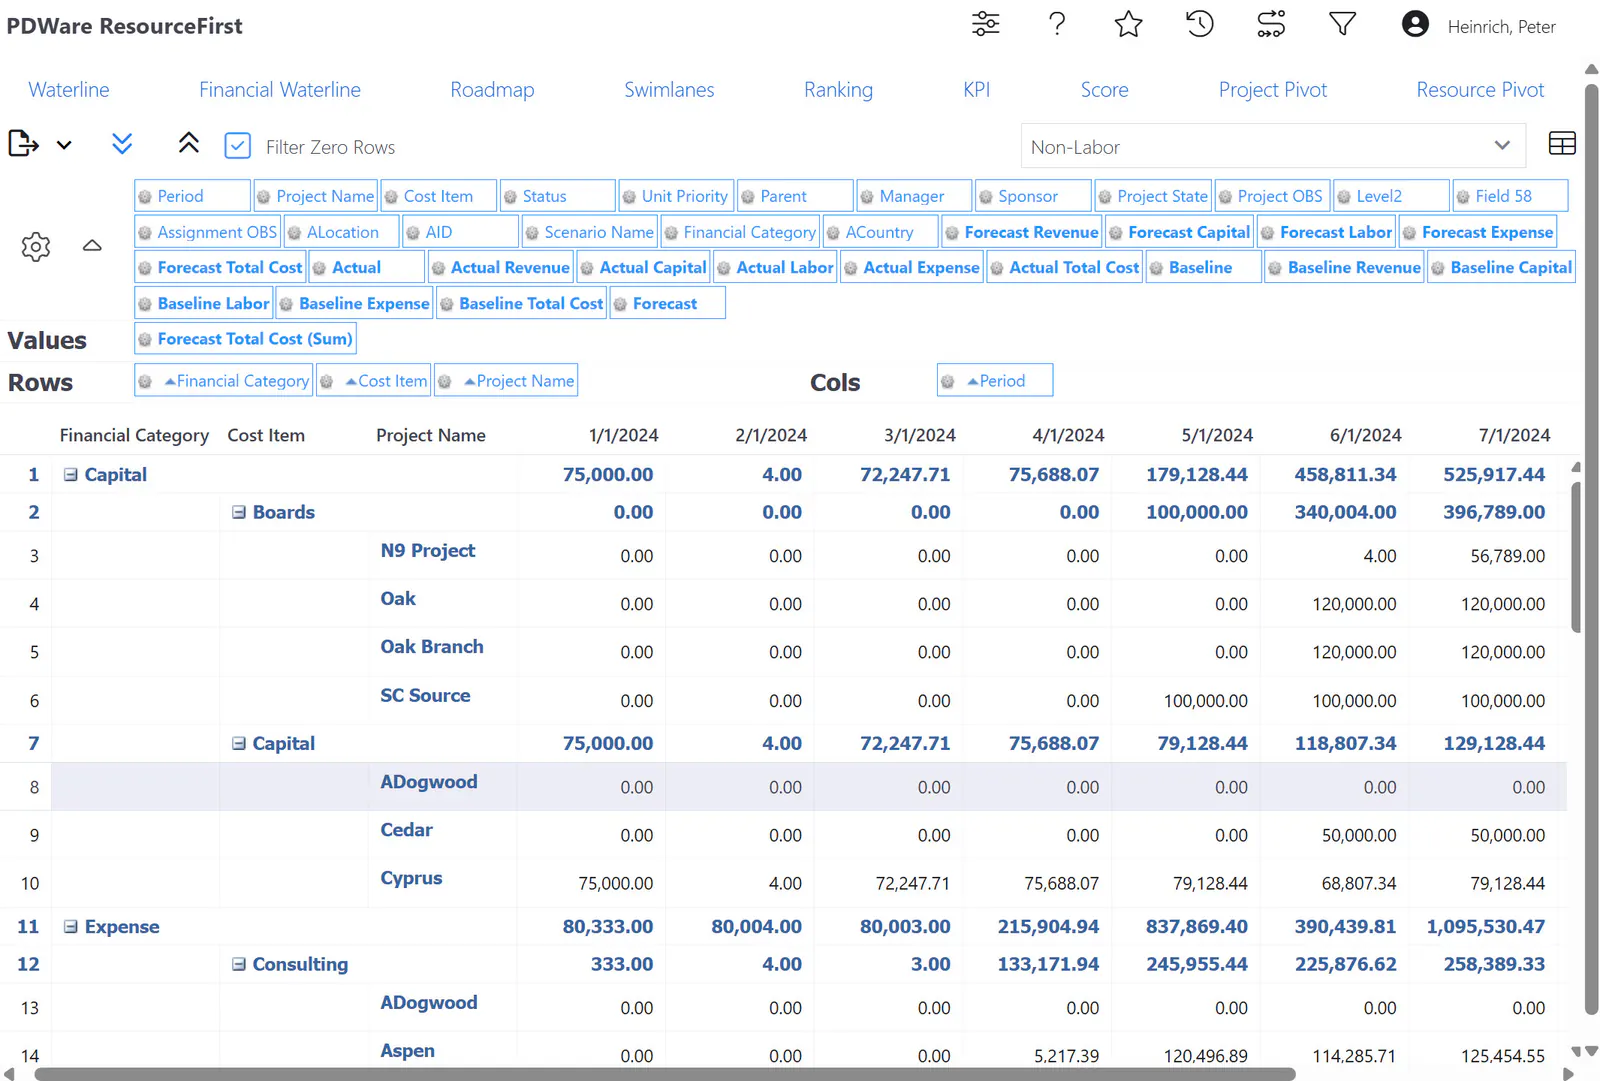
Financial Pivot
The example below shows Forecast Cost by Financial Category, Cost Item, and Project.
Skill Pivot
The example below shows Capacity, Forecast, and Utilization % by Skill.