Project Roadmap
This article shows how to use the Roadmap page in the Analysis area.
Overview
The Roadmap page displays a row for each project. Three object types can be displayed on each project row:
A start to finish bar – requires dates in project Start and End date fields on the Project Data or Forms page
Phase bars – requires Phases with phase name, start and end dates on the project Detail Forms page
Milestones – requires Milestones with milestone name and date on the project Detail Forms page.
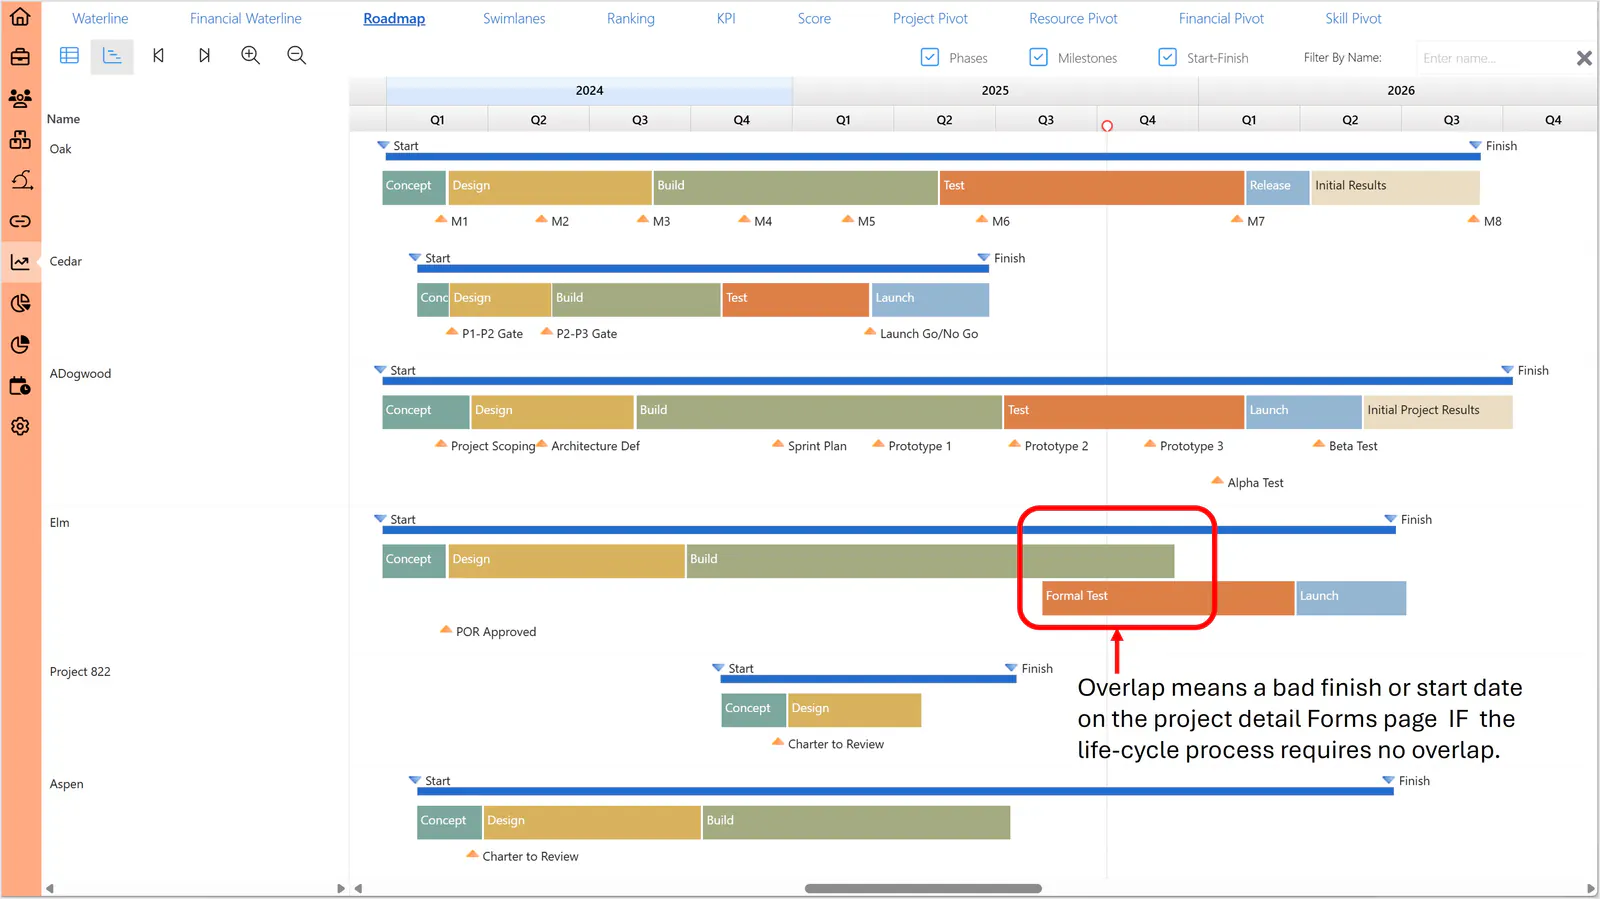
Scheduler (Gantt) Mode
The default initial display of this page is in Scheduler mode (see below) with projects in priority* order.
“Priority” assumes that project priority is part of the admin configurable order for allocation of resources to projects.
This page can be sorted by project name. Once sorted by project name, the page can be sorted ascending or descending by project name only.
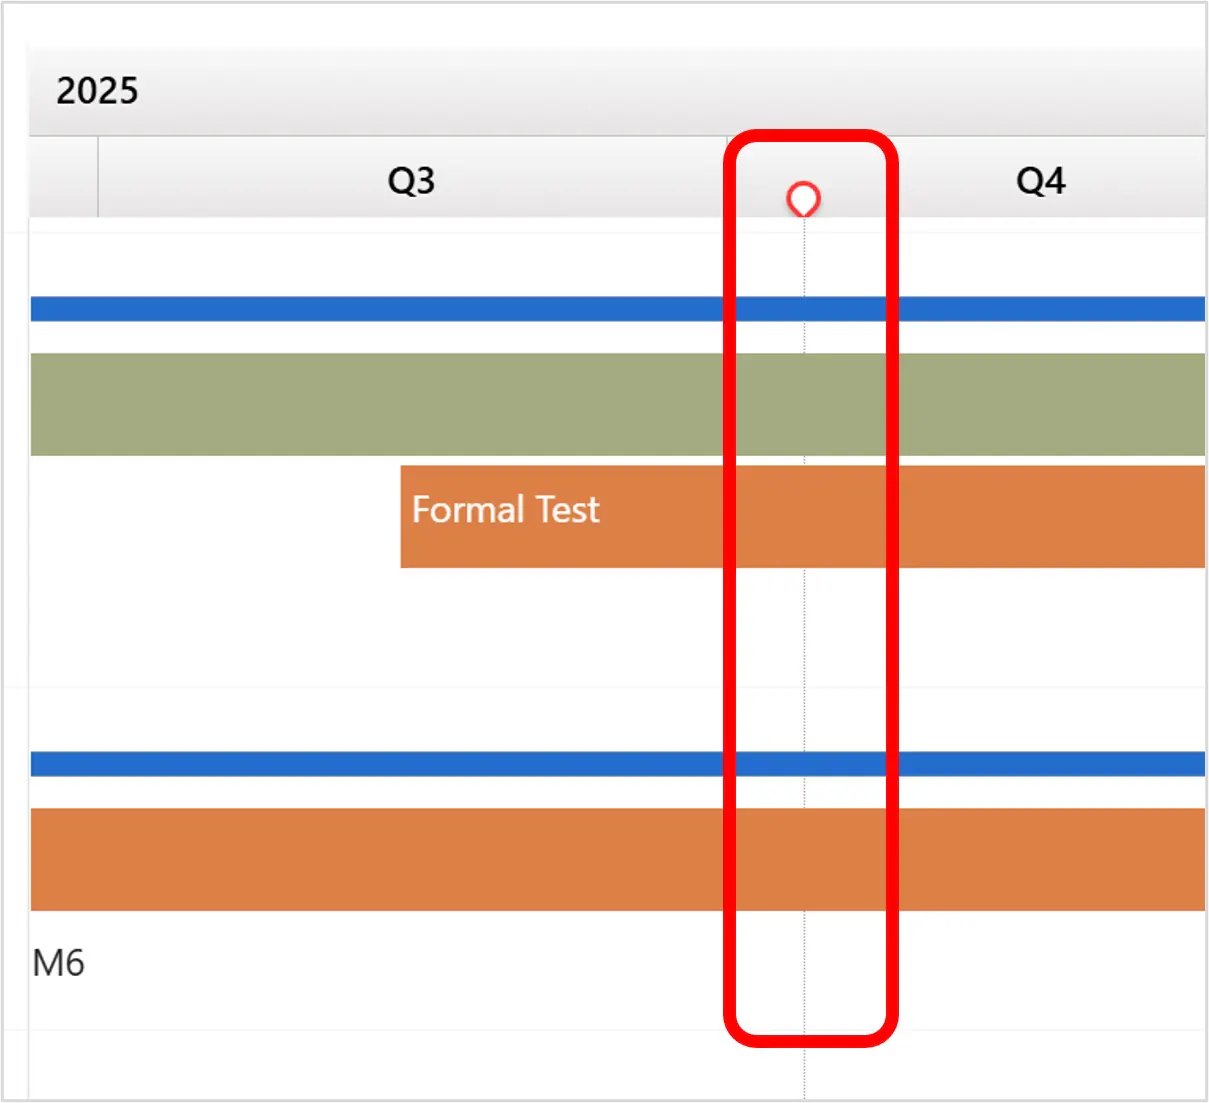
The defaults for zoom and timescale are set to display the current date line near the left of the Scheduler pane.
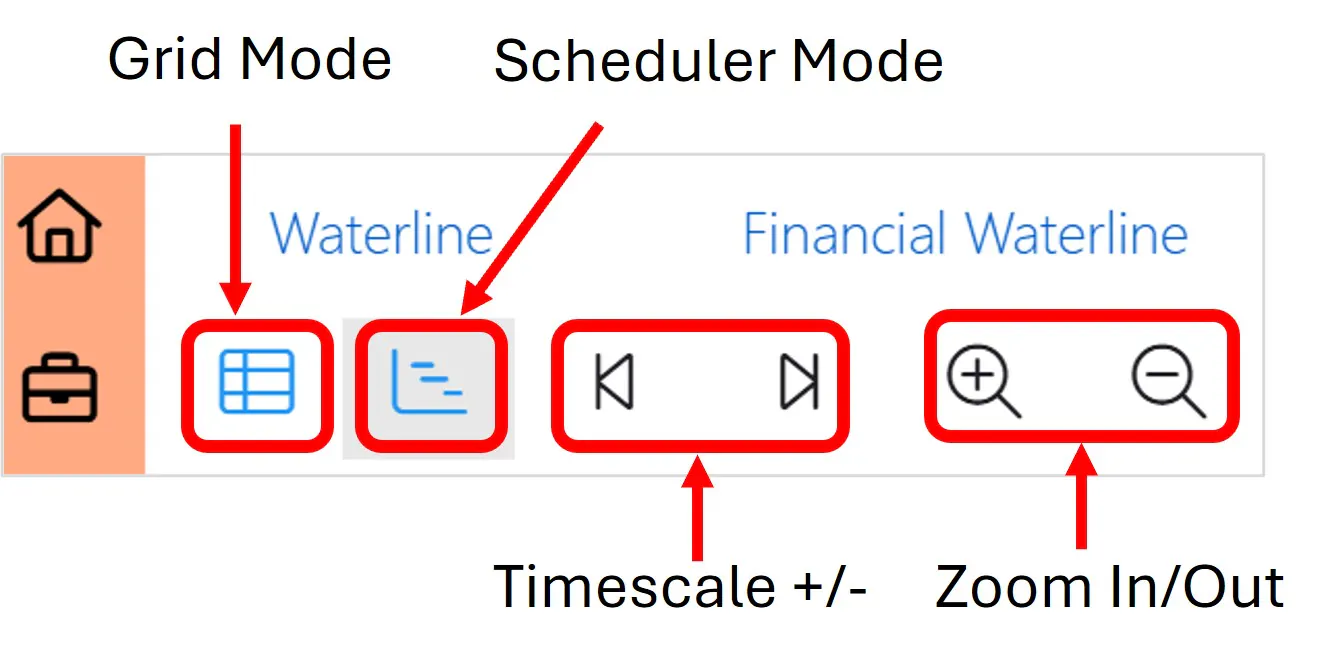
Adjusting Zoom and Timescale
The Timespan icons move the display left and right 1 year; they behave the same as left and right horizontal scroll.
The Zoom In/Out icons expand or contract the display area.
Displaying Optional Objects for Each Project
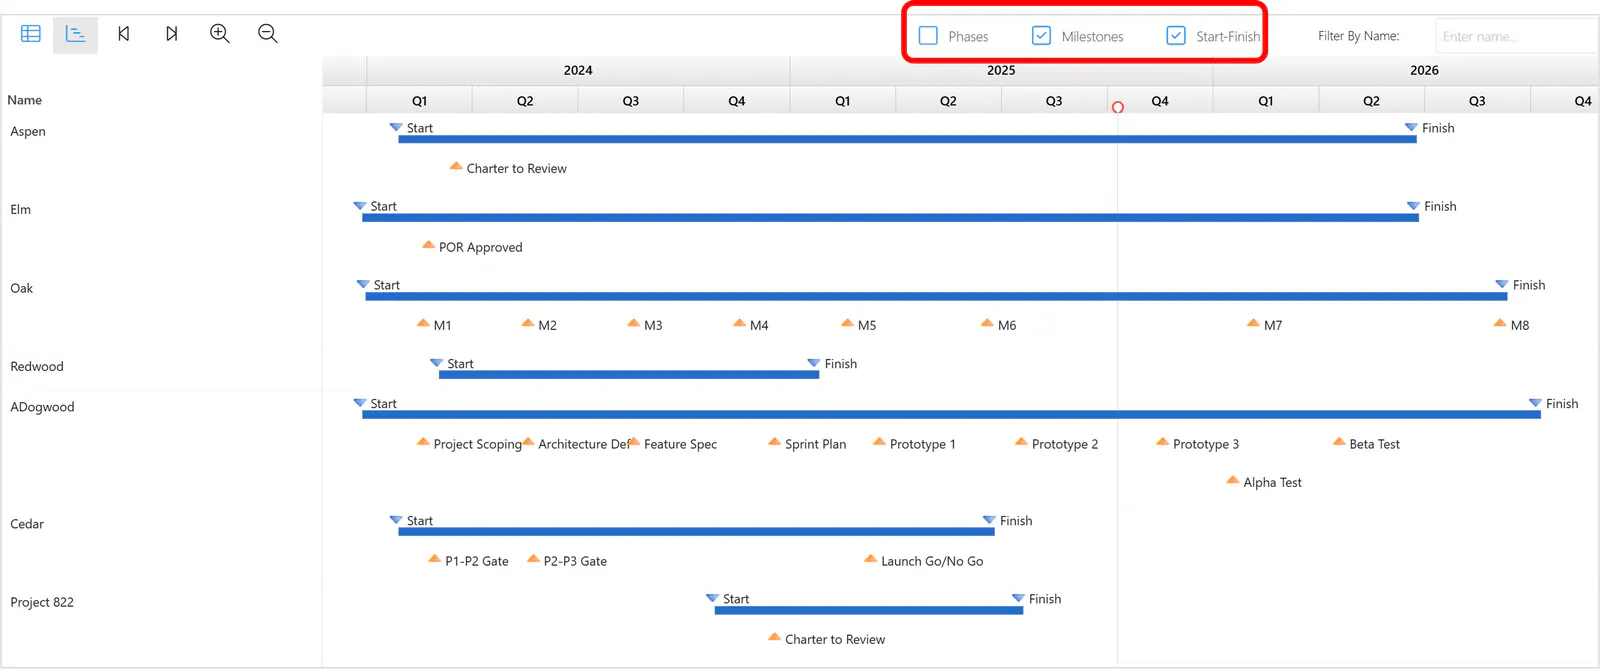
The objects displayed for each project are determined by the checkboxes at the upper right of the page. All three are checked by default when the page is first opened or a reload occurs.
Milestone and Start-Finish
Filtering Objects By Name on Project Rows
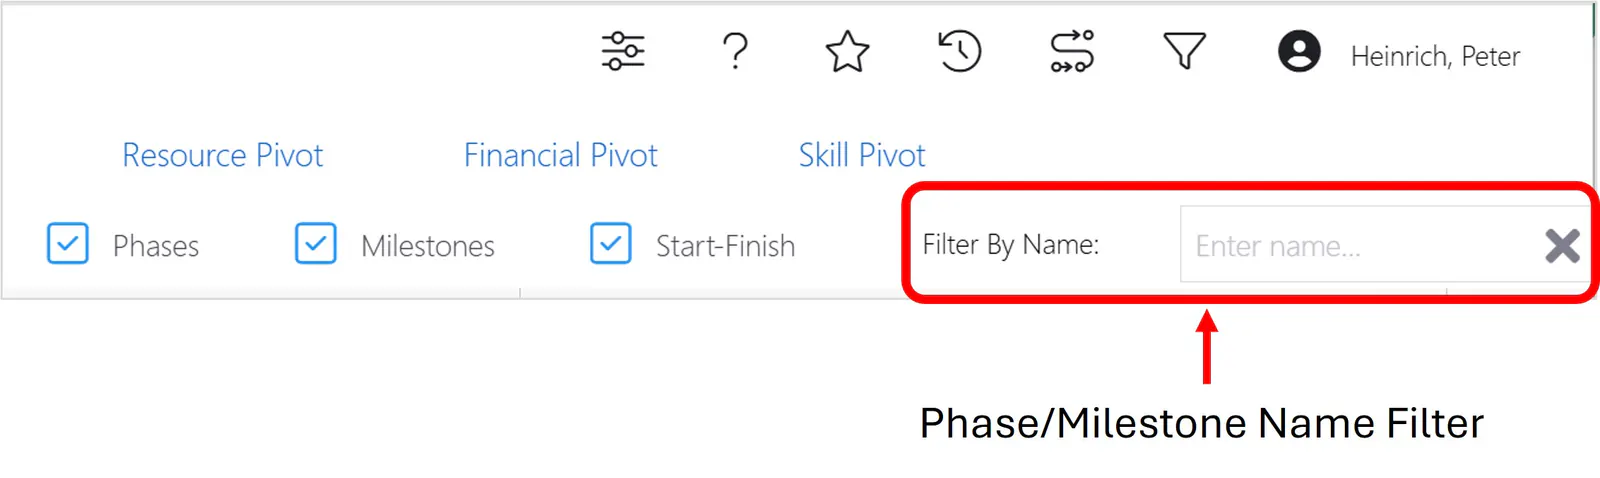
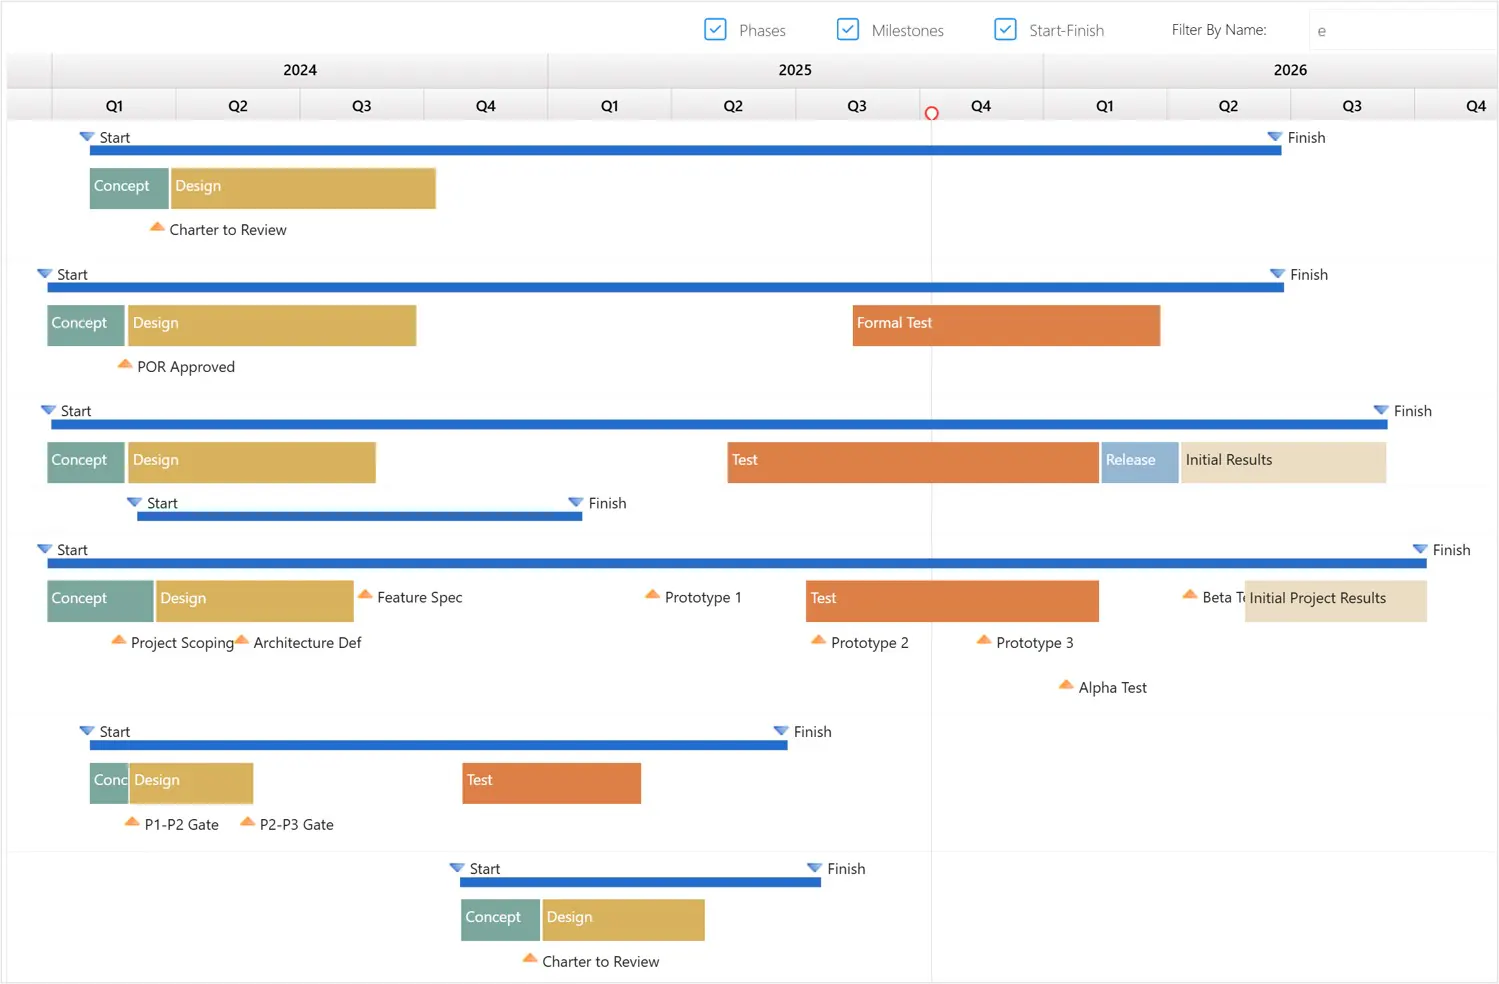
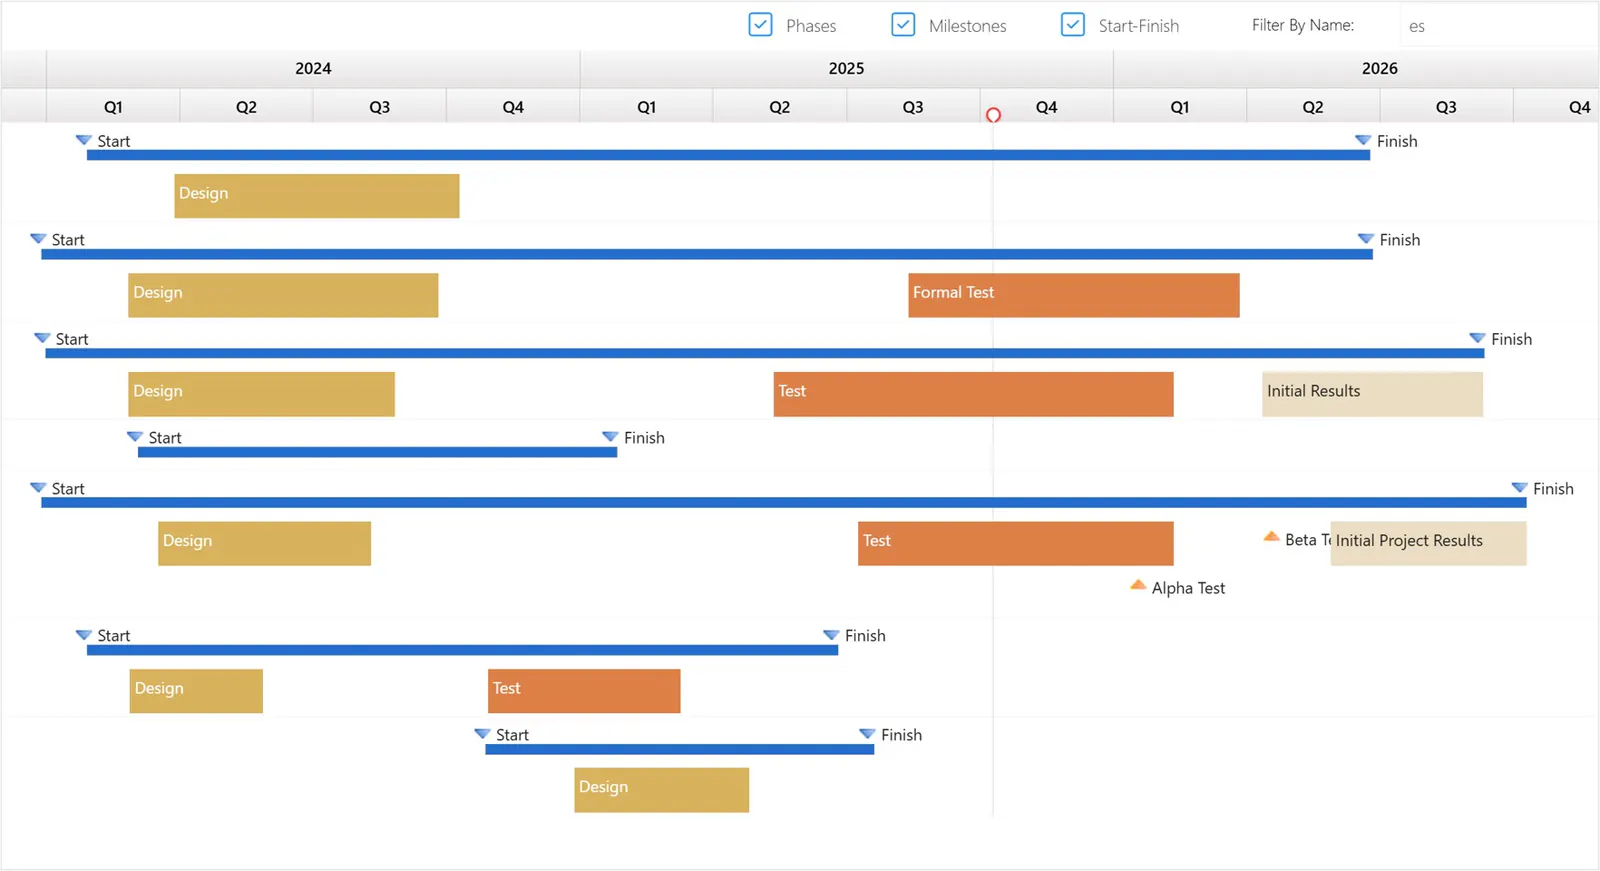
The Filter By Name control filters phases and milestones by the text entered in the control IF the display checkboxes are checked.
For example, enter the word “design” in the filter if you want to see only the phases and milestones with names that include that term. Or enter a single letter or a combination of letters.
The start to finish duration bar and milestones are not subject to the filter; if checked, they are displayed.
Filter on “e”
Filter on “es”
Grid Mode
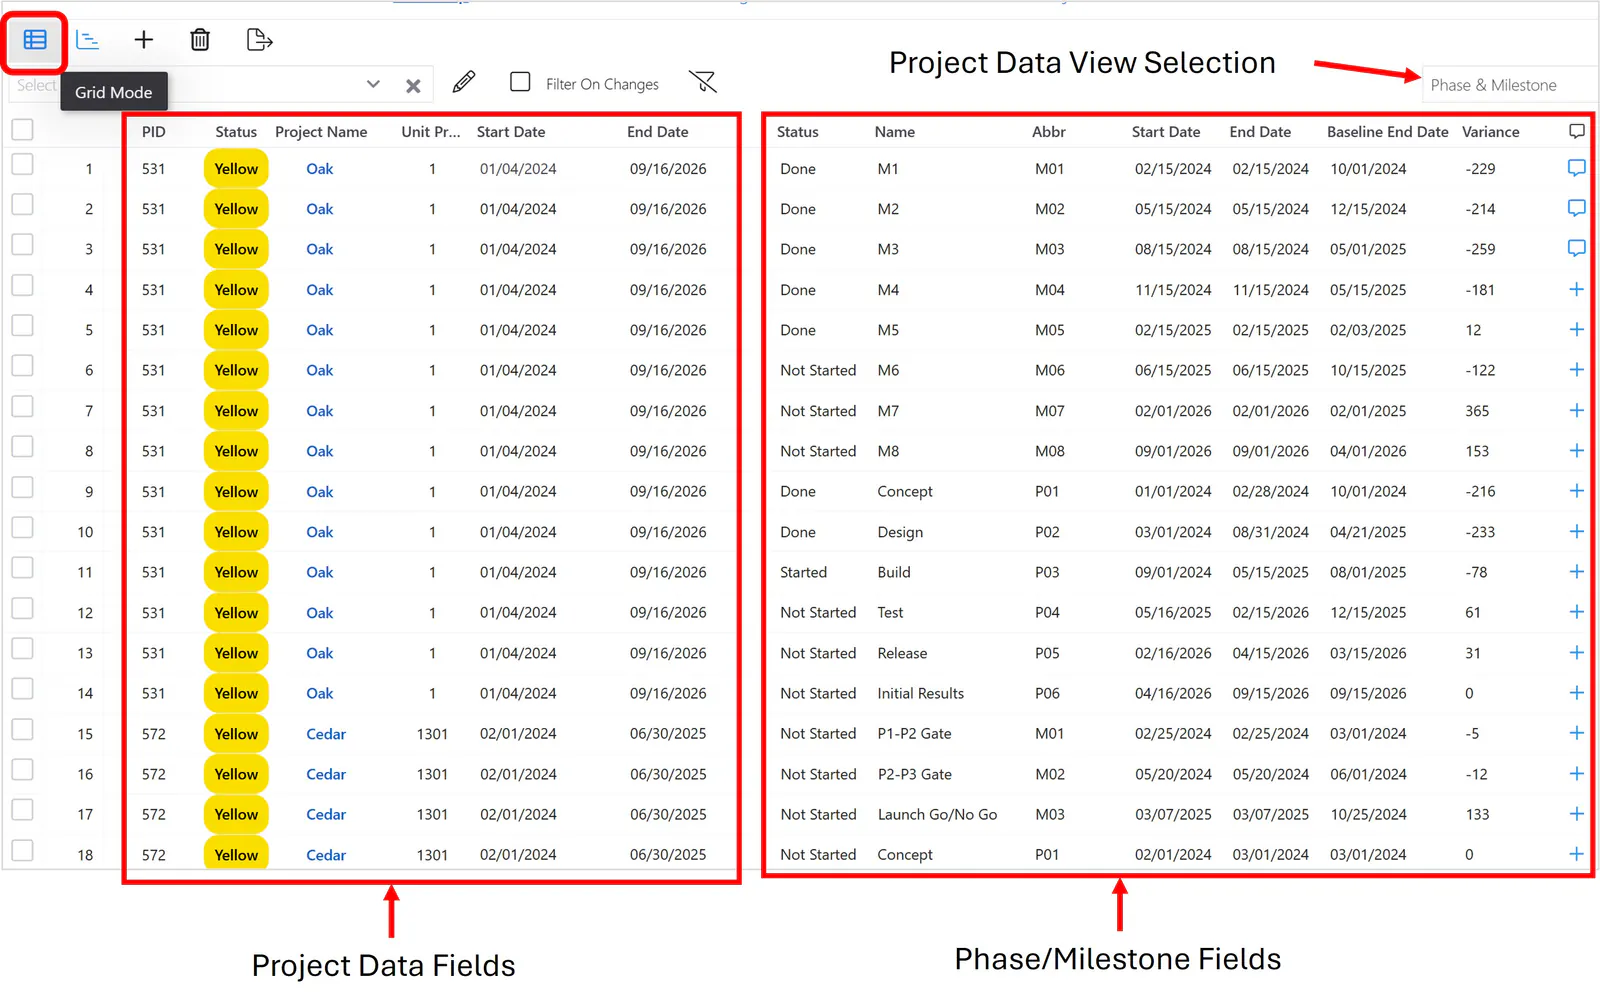
This mode displays a row for every phase and milestone on the roadmap.
The fields in the selected Project Data view are at the left of each row. The fields to the right of each row display the values for the phase or milestone – Name, Abbreviation, Start & End dates, Status, plus the comment entry field.
In the screenshot below, the only fields in the project view are Project PID, Status, Name, Start Date, Unit Priority and End Date. They are repeated for every phase and milestone row in the project.
Comments on Phases and Milestones
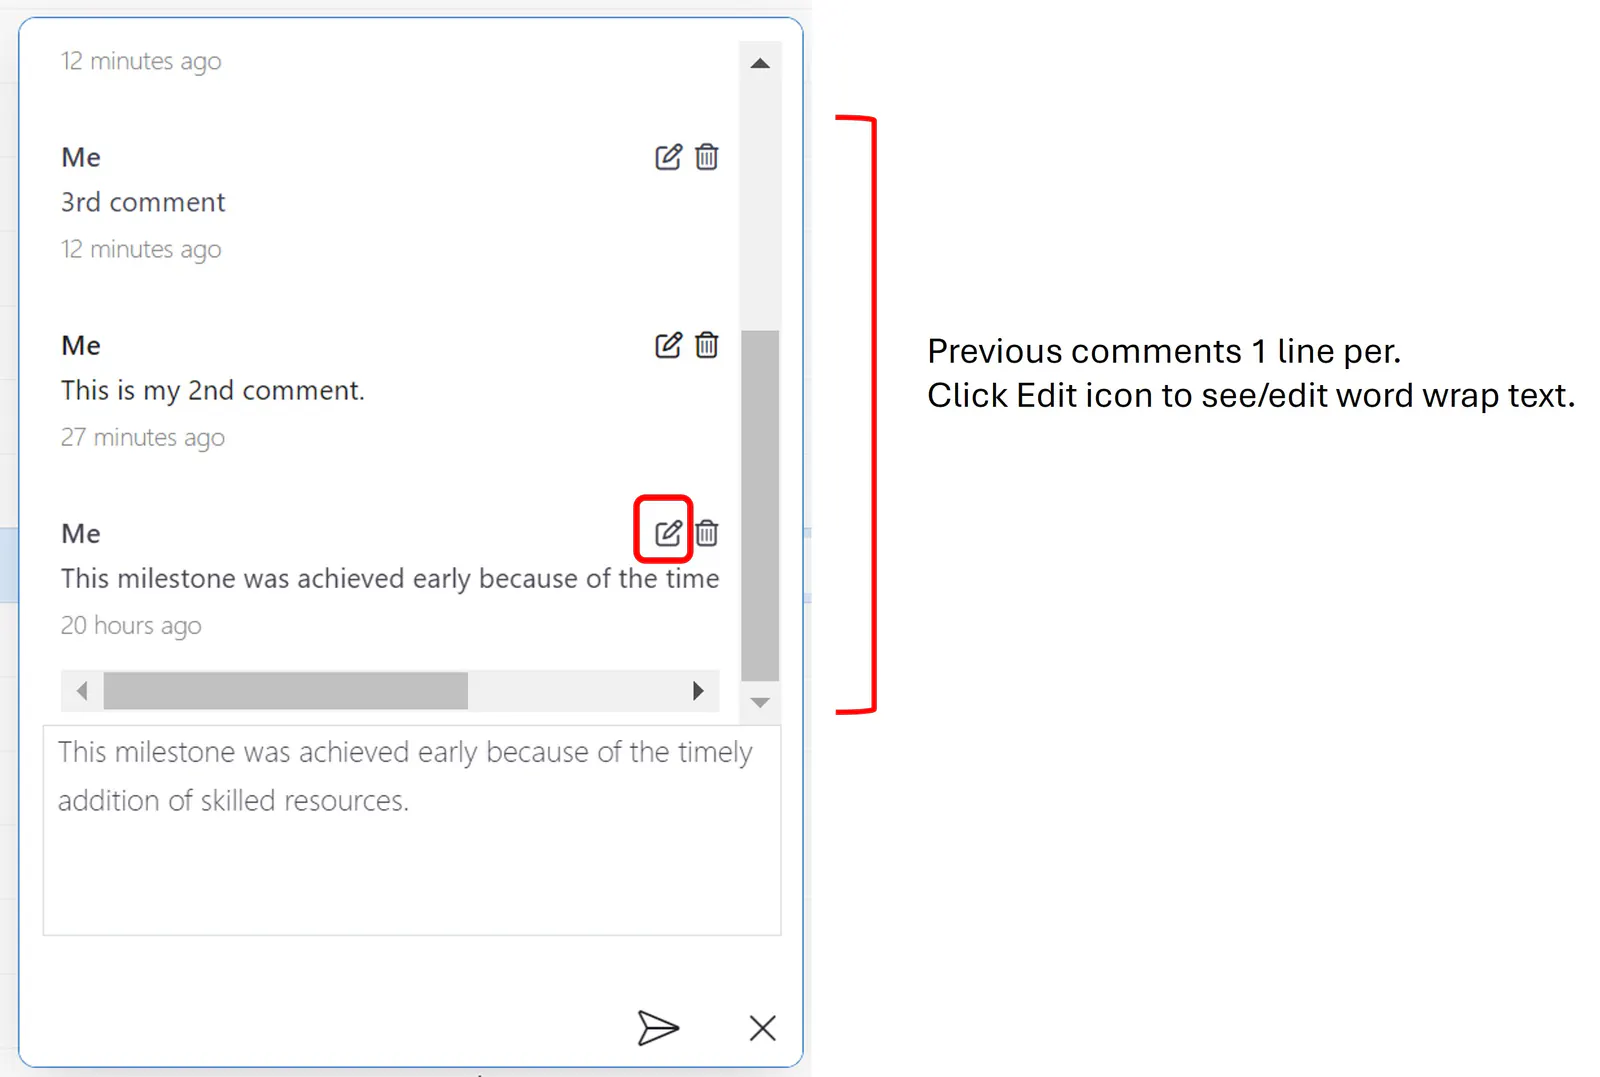
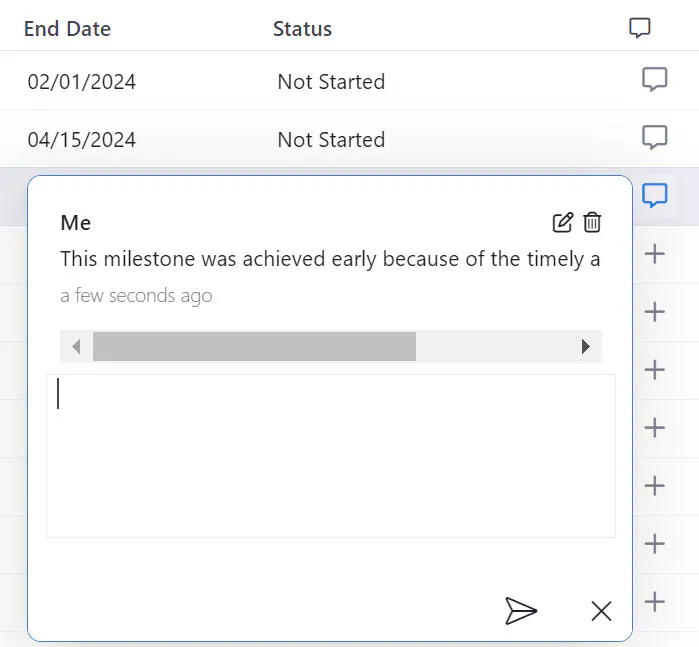
The rightmost column of grid mode is for comments on the phases and milestones.
Click the “+” to enter a comment.
Hover over the comment bubble to read the text of the comment and or add a comment.
Display / Edit Comment